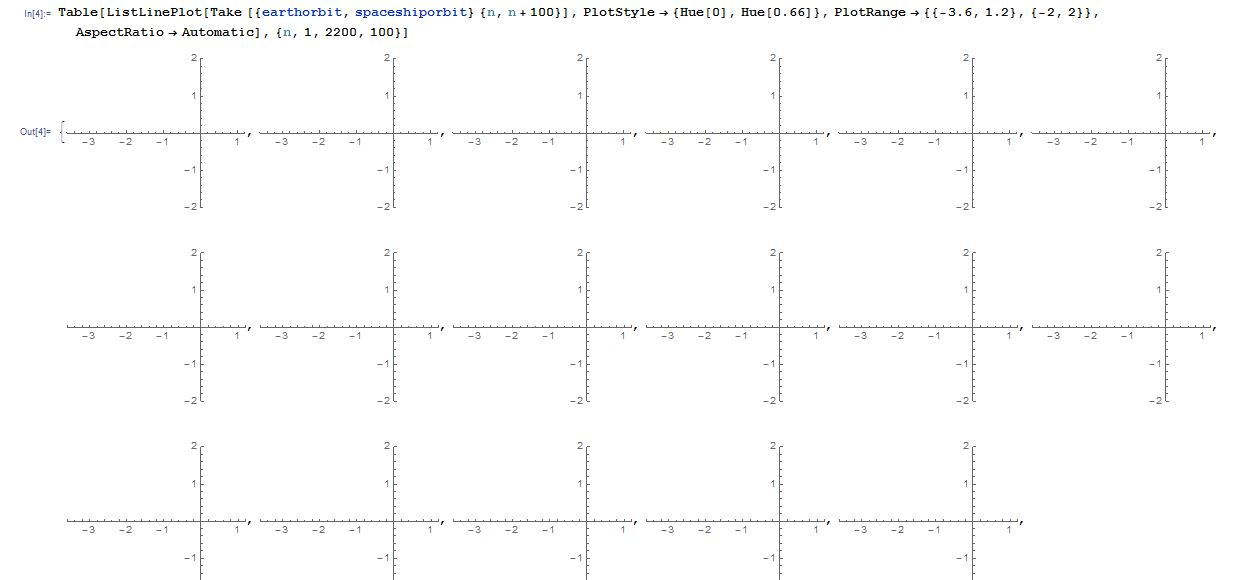

Thank you for your very satisfying answer, mr. Alex Trounev. but can you help me, I want to show the graphics with codes in figure 4 from your mr. But even i tried to use your codes, it doesn't my expected.
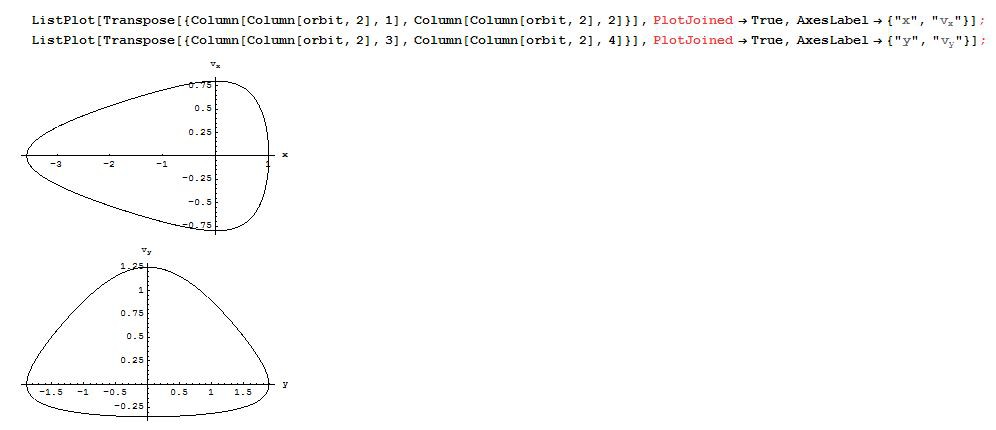
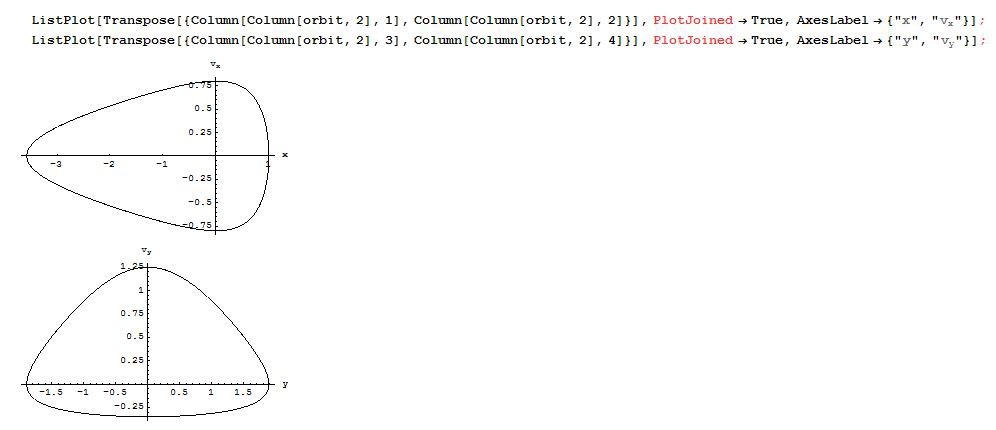
The graphics I want as below mr. Alex Trounev


ListPlot[Transpose[{Column[orbit,1],Column[Column[orbit,2],1]}],AxesLabel->{"t","x"}]

ListPlot[Transpose[{Column[orbit,1],Column[Column[orbit,2],2]}],AxesLabel->{"t","Vx"}]

ListPlot[Transpose[{Column[orbit,1],Column[Column[orbit,2],3]}],AxesLabel->{"t","y"}]

ListPlot[Transpose[{Column[orbit,1],Column[Column[orbit,2],4]}],AxesLabel->{"t","Vy"}]


ListPlot[Transpose[{Column[Column[orbit,2],1],Column[Column[orbit,2],2]}],AxesLabel->{"x","Vx"}]

ListPlot[Transpose[{Column[Column[orbit,2],3],Column[Column[orbit,2],4]}],AxesLabel->{"y","Vy"}]
Your answer is really very helpful. 🙏
i tried to running the program from data interpolation functions, first, its work, but i tried to delete and input again, the program has an error mr.@Alex Trounev like this..


