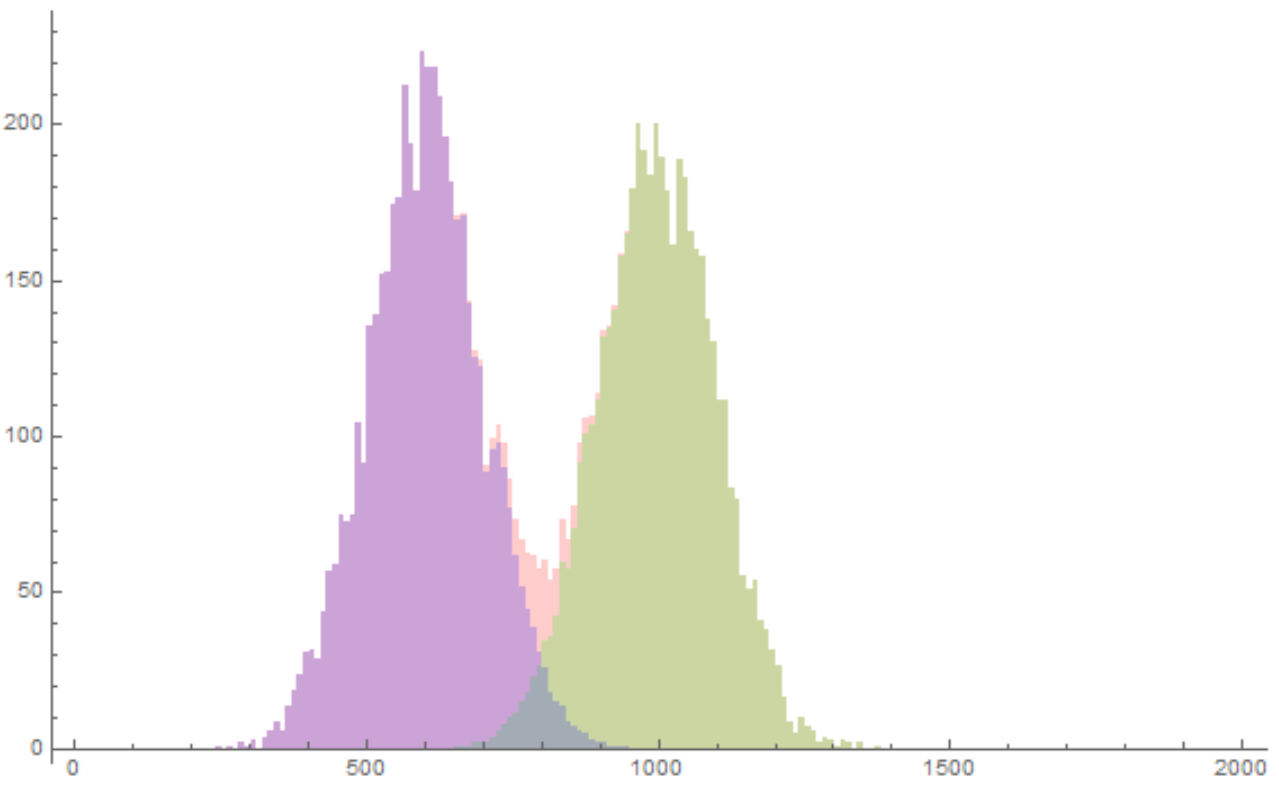
Here is my crude solution. It entails evaluating the relative weight of each PDF at a given bin and distributing the datapoints within each bin accordingly.
(* Generate some data *)
SeedRandom[12345];
data = RandomVariate[MixtureDistribution[{.5, .5},
{NormalDistribution[600, 100], NormalDistribution[1000, 100]}], 10000];

(* Find estimates of the parameters *)
params = FindDistributionParameters[data, MixtureDistribution[{w1, 1 - w1},
{NormalDistribution[μ1, σ1], NormalDistribution[μ2, σ2]}]]
(* {w1 -> 0.506923, μ1 -> 1000.2, σ1 -> 101.254, μ2 -> 601.278, σ2 -> 101.584} *)
First, I save the BinList and HistogramList of data for future use making suer to use the same bin criteria.
hlist=HistogramList[data,{0,5000,10}];
blist=BinLists[data,{0,5000,10}];
I then find the midpoint of the histogram bins by iterating through HistogramList bin ranges.
midpoints =
Table[(hlist[[1, i]] + hlist[[1, i + 1]])/2, {i, 1, Length[hlist[[1]]] - 1}];
Then, I prepare to divvy up the elements of data by calculating the relative probability of the fitted PDFs evaluated at the bin midpoints.
portion1 =Table[Round[PDF[NormalDistribution[μ1, σ1]][midpoints[[i]]]/
(PDF[NormalDistribution[μ1, σ1]][midpoints[[i]]] +
PDF[NormalDistribution[μ2, σ2]][midpoints[[i]]] +
.000001)*hlist[[2, i]] /. params, 1], {i, 1, Length[midpoints]}];
I then take the portions of datapoints from the BinList data and save them as their own variables.
hist1 = Table[Take[blist[[i]], portion1[[i]]], {i, 1, Length[blist]}]
hist2 = Flatten[Table[Take[blist[[i]], {portion1[[i]] + 1,Length[blist[[i]]]}], {i, 1, Length[blist]}]];
and voila,
Histogram[{data, hist1, hist2}, {0, 2000, 10},
ChartStyle -> {Directive[Red, Opacity[.2]], Directive[Green, Opacity[.2]], Directive[Blue, Opacity[.2]]}]
Edit 1: Cleaning. [1]: https://i.sstatic.net/89Evk.png

