added 713 characters in body
Source Link
kglr
  • 400.5k
  • 18
  • 488
  • 929

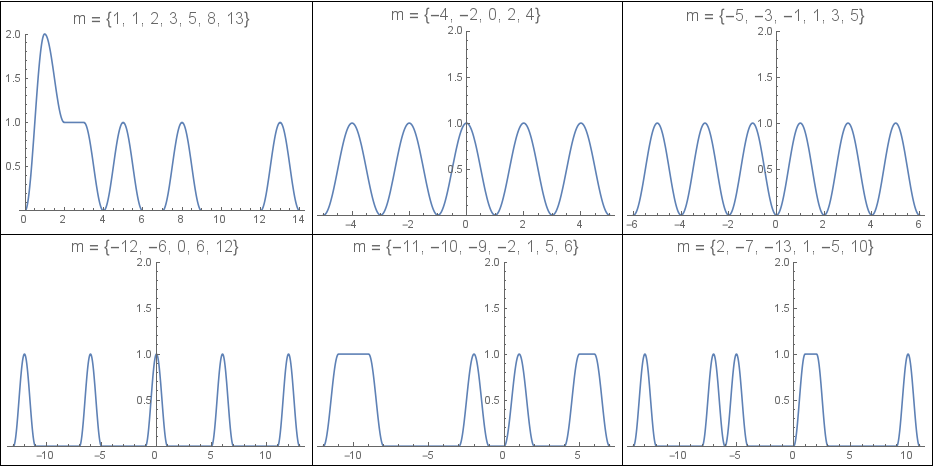
Update: A function that takes an arbitrary list of integers as the second argument:

ClearAll[f2]
f2[x_?NumericQ, m : {__Integer}] := Total[Cos[Pi*(Clip[x - #]/2)]^2 & /@ m]
Grid[Partition[Plot[f2[x, #], {x, -1 + Min@#, 1 + Max@#}, PlotRange -> {0, 2}, 
    ImageSize -> 300, PlotLabel -> Style["m = " <> ToString[#], 16]] & /@ 
  {Fibonacci[Range@7], Select[Range[-5, 5], EvenQ], 
   Select[Range[-5, 5], OddQ], Select[Range[-15, 15], Divisible[#, 6] &], 
   {-11, -10, -9, -2,  1,  5, 6}, RandomSample[Range[-15, 15], 6]}, 3], 
 Dividers -> All]

enter image description here

Original answer:

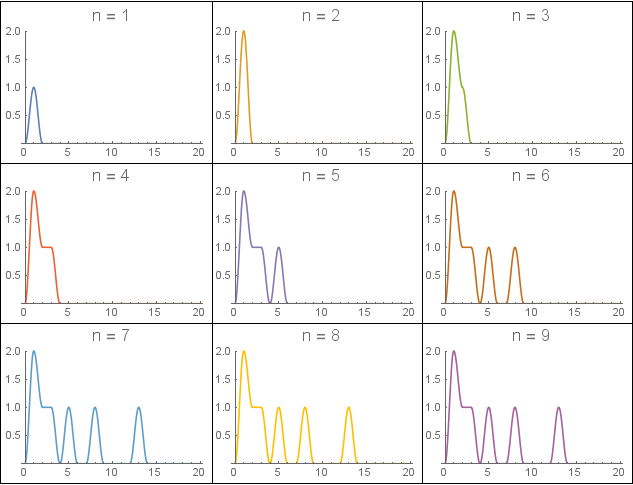
ClearAll[f1]
f1[x_?NumericQ, n_Integer] := Total[Cos[Pi*(Clip[x - #]/2)]^2 & /@ Fibonacci[Range[n]]]
Grid[Partition[Plot[f1[x, #] , {x, 0, 20}, PlotStyle -> ColorData[97][#], 
     PlotLabel -> Style["n = " <> ToString[#], 16], 
     PlotRange -> {0, 2}, ImageSize -> 200] & /@ Range[9], 3], 
 Dividers -> All]

enter image description here

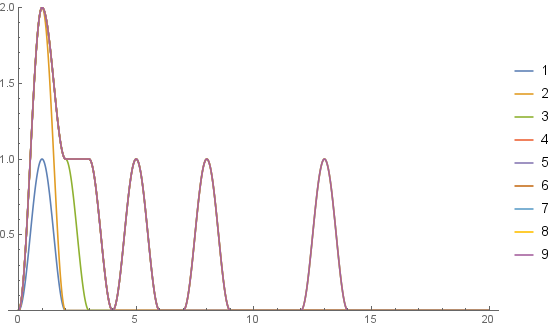
Plot[Evaluate[f1[x, #] & /@ Range[9]], {x, 0, 20}, 
  PlotRange -> {0, 2}, PlotLegends -> Range[9], ImageSize -> 500]

enter image description here

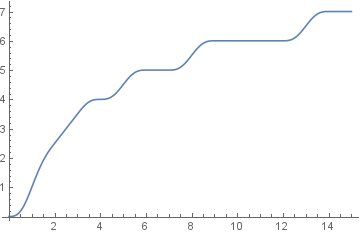
ClearAll[f2]
f2[x_?NumericQ, n_Integer] := NIntegrate[f1[s, n], {s, 0, x}]
ListLinePlot[Table[{x, f2[x, 7]}, {x, 0, 15, 1/100}]]

enter image description here

ClearAll[f1]
f1[x_?NumericQ, n_Integer] := Total[Cos[Pi*(Clip[x - #]/2)]^2 & /@ Fibonacci[Range[n]]]
Grid[Partition[Plot[f1[x, #] , {x, 0, 20}, PlotStyle -> ColorData[97][#], 
     PlotLabel -> Style["n = " <> ToString[#], 16], 
     PlotRange -> {0, 2}, ImageSize -> 200] & /@ Range[9], 3], 
 Dividers -> All]

enter image description here

Plot[Evaluate[f1[x, #] & /@ Range[9]], {x, 0, 20}, 
  PlotRange -> {0, 2}, PlotLegends -> Range[9], ImageSize -> 500]

enter image description here

ClearAll[f2]
f2[x_?NumericQ, n_Integer] := NIntegrate[f1[s, n], {s, 0, x}]
ListLinePlot[Table[{x, f2[x, 7]}, {x, 0, 15, 1/100}]]
enter image description here

Update: A function that takes an arbitrary list of integers as the second argument:

ClearAll[f2]
f2[x_?NumericQ, m : {__Integer}] := Total[Cos[Pi*(Clip[x - #]/2)]^2 & /@ m]
Grid[Partition[Plot[f2[x, #], {x, -1 + Min@#, 1 + Max@#}, PlotRange -> {0, 2}, 
    ImageSize -> 300, PlotLabel -> Style["m = " <> ToString[#], 16]] & /@ 
  {Fibonacci[Range@7], Select[Range[-5, 5], EvenQ], 
   Select[Range[-5, 5], OddQ], Select[Range[-15, 15], Divisible[#, 6] &], 
   {-11, -10, -9, -2,  1,  5, 6}, RandomSample[Range[-15, 15], 6]}, 3], 
 Dividers -> All]

enter image description here

Original answer:

ClearAll[f1]
f1[x_?NumericQ, n_Integer] := Total[Cos[Pi*(Clip[x - #]/2)]^2 & /@ Fibonacci[Range[n]]]
Grid[Partition[Plot[f1[x, #] , {x, 0, 20}, PlotStyle -> ColorData[97][#], 
     PlotLabel -> Style["n = " <> ToString[#], 16], 
     PlotRange -> {0, 2}, ImageSize -> 200] & /@ Range[9], 3], 
 Dividers -> All]

enter image description here

Plot[Evaluate[f1[x, #] & /@ Range[9]], {x, 0, 20}, 
  PlotRange -> {0, 2}, PlotLegends -> Range[9], ImageSize -> 500]

enter image description here

ClearAll[f2]
f2[x_?NumericQ, n_Integer] := NIntegrate[f1[s, n], {s, 0, x}]
ListLinePlot[Table[{x, f2[x, 7]}, {x, 0, 15, 1/100}]]
enter image description here

Source Link
kglr
  • 400.5k
  • 18
  • 488
  • 929

ClearAll[f1]
f1[x_?NumericQ, n_Integer] := Total[Cos[Pi*(Clip[x - #]/2)]^2 & /@ Fibonacci[Range[n]]]
Grid[Partition[Plot[f1[x, #] , {x, 0, 20}, PlotStyle -> ColorData[97][#], 
     PlotLabel -> Style["n = " <> ToString[#], 16], 
     PlotRange -> {0, 2}, ImageSize -> 200] & /@ Range[9], 3], 
 Dividers -> All]

enter image description here

Plot[Evaluate[f1[x, #] & /@ Range[9]], {x, 0, 20}, 
  PlotRange -> {0, 2}, PlotLegends -> Range[9], ImageSize -> 500]

enter image description here

ClearAll[f2]
f2[x_?NumericQ, n_Integer] := NIntegrate[f1[s, n], {s, 0, x}]
ListLinePlot[Table[{x, f2[x, 7]}, {x, 0, 15, 1/100}]]
enter image description here