added 730 characters in body
Source Link
kglr
  • 400.5k
  • 18
  • 488
  • 929

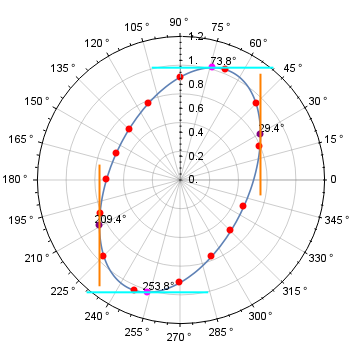
Update: Starting with theta = 65; and going through the same steps:

PolarPlot[yy, {x, 0, 2*Pi}, PolarAxes -> True, 
 PolarTicks -> {"Degrees", Automatic}, PolarGridLines -> True, 
 Mesh -> 15, MeshStyle -> Directive[PointSize[Large], Red], 
 Epilog -> {Text[Style[ToString[Round[#/Degree, .1]] <> "°", Black],
       {.1, .05} + (f@#)] & /@ Join[pts1, pts2] , 
   Thick, Purple, PointSize[Large], Point[f /@ pts1], 
   Magenta, Point[f /@ pts2], 
   Cyan, Line /@ ({{# - 1/2, #2}, {# + 1/2, #2}} & @@@ (f /@ pts2)), 
   Orange, Line /@ ({{#, #2 - 1/2}, {#, #2 + 1/2}} & @@@ (f /@ pts1))}]

enter image description here

added 18 characters in body
Source Link
kglr
  • 400.5k
  • 18
  • 488
  • 929
yy = 1 / gc;
f[x_] := Evaluate[yy {Cos[x], Sin[x]}]
tangent[x_] := Evaluate[Simplify@FrenetSerretSystem[f[x], x][[2, 1]]]

pts1 = N[x /. Solve[{Divide @@ tangent[x] == 0, 0 <= x <= 2 Pi}, x, Reals]]

{0.197395, 3.33898}

pts2 = N[x /. Solve[{Divide[#2, #1] & @@ tangent[x] == 0, 0 <= x <= 2 Pi}, x, Reals]]

{4.51499, 1.3734007}

epilog = {Text[Style[ToString[Round[#/Degree, .1]] <> "°", Black],
       {.1, .05} + (f@#)] & /@ Join[pts1, pts2], 
    Thick, Purple, PointSize[Large] , Point[f /@ pts1], 
    Magenta, Point[f /@ pts2], Green, Point[f[#]], 
    Cyan, Line /@ ({{# - 1/3, #2}, {# + 1/3, #2}} & @@@ (f /@ pts2)), 
    Orange, Line /@ ({{#, #2 - 1/3}, {#, #2 + 1/3}} & @@@ (f /@ pts1)), 
    Red, Line[{f[#] - .5 tangent[#], f[#] + .5 tangent[#]}]} &;

Manipulate[PolarPlot[yy, {x, 0, 2 Pi}, Epilog -> epilog[-t]], {t, 0, 2 Pi, Pi/100}]
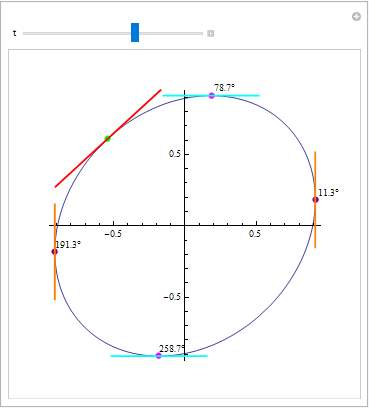
enter image description here

Using OP's code with the option Epilog:

PolarPlot[yy, {x, 0, 2*Pi}, PolarAxes -> True, 
 PolarTicks -> {"Degrees", Automatic}, PolarGridLines -> True, 
 Mesh -> 15, MeshStyle -> Directive[PointSize[Large], Red], 
 Epilog -> {Thick, Purple, PointSize[Large] , Point[f /@ pts1], 
   Magenta, Point[f /@ pts2], 
   Cyan, Line /@ ({{# - 1/2, #2}, {# + 1/2, #2}} & @@@ (f /@ pts2)), 
   Orange, Line /@ ({{#, #2 - 1/2}, {#, #2 + 1/2}} & @@@ (f /@ pts1))}]
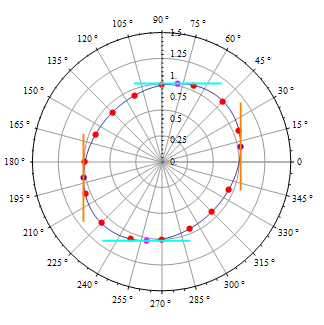
enter image description here

f[x_] := Evaluate[yy {Cos[x], Sin[x]}]
tangent[x_] := Evaluate[Simplify@FrenetSerretSystem[f[x], x][[2, 1]]]

pts1 = N[x /. Solve[{Divide @@ tangent[x] == 0, 0 <= x <= 2 Pi}, x, Reals]]

{0.197395, 3.33898}

pts2 = N[x /. Solve[{Divide[#2, #1] & @@ tangent[x] == 0, 0 <= x <= 2 Pi}, x, Reals]]

{4.51499, 1.3734007}

epilog = {Text[Style[ToString[Round[#/Degree, .1]] <> "°", Black],
       {.1, .05} + (f@#)] & /@ Join[pts1, pts2], 
    Thick, Purple, PointSize[Large] , Point[f /@ pts1], 
    Magenta, Point[f /@ pts2], Green, Point[f[#]], 
    Cyan, Line /@ ({{# - 1/3, #2}, {# + 1/3, #2}} & @@@ (f /@ pts2)), 
    Orange, Line /@ ({{#, #2 - 1/3}, {#, #2 + 1/3}} & @@@ (f /@ pts1)), 
    Red, Line[{f[#] - .5 tangent[#], f[#] + .5 tangent[#]}]} &;

Manipulate[PolarPlot[yy, {x, 0, 2 Pi}, Epilog -> epilog[-t]], {t, 0, 2 Pi, Pi/100}]

enter image description here

Using OP's code with the option Epilog:

PolarPlot[yy, {x, 0, 2*Pi}, PolarAxes -> True, 
 PolarTicks -> {"Degrees", Automatic}, PolarGridLines -> True, 
 Mesh -> 15, MeshStyle -> Directive[PointSize[Large], Red], 
 Epilog -> {Thick, Purple, PointSize[Large] , Point[f /@ pts1], 
   Magenta, Point[f /@ pts2], 
   Cyan, Line /@ ({{# - 1/2, #2}, {# + 1/2, #2}} & @@@ (f /@ pts2)), 
   Orange, Line /@ ({{#, #2 - 1/2}, {#, #2 + 1/2}} & @@@ (f /@ pts1))}]

enter image description here

yy = 1 / gc;
f[x_] := Evaluate[yy {Cos[x], Sin[x]}]
tangent[x_] := Evaluate[Simplify@FrenetSerretSystem[f[x], x][[2, 1]]]

pts1 = N[x /. Solve[{Divide @@ tangent[x] == 0, 0 <= x <= 2 Pi}, x, Reals]]

{0.197395, 3.33898}

pts2 = N[x /. Solve[{Divide[#2, #1] & @@ tangent[x] == 0, 0 <= x <= 2 Pi}, x, Reals]]

{4.51499, 1.3734007}

epilog = {Text[Style[ToString[Round[#/Degree, .1]] <> "°", Black],
       {.1, .05} + (f@#)] & /@ Join[pts1, pts2], 
    Thick, Purple, PointSize[Large] , Point[f /@ pts1], 
    Magenta, Point[f /@ pts2], Green, Point[f[#]], 
    Cyan, Line /@ ({{# - 1/3, #2}, {# + 1/3, #2}} & @@@ (f /@ pts2)), 
    Orange, Line /@ ({{#, #2 - 1/3}, {#, #2 + 1/3}} & @@@ (f /@ pts1)), 
    Red, Line[{f[#] - .5 tangent[#], f[#] + .5 tangent[#]}]} &;

Manipulate[PolarPlot[yy, {x, 0, 2 Pi}, Epilog -> epilog[-t]], {t, 0, 2 Pi, Pi/100}]

enter image description here

Using OP's code with the option Epilog:

PolarPlot[yy, {x, 0, 2*Pi}, PolarAxes -> True, 
 PolarTicks -> {"Degrees", Automatic}, PolarGridLines -> True, 
 Mesh -> 15, MeshStyle -> Directive[PointSize[Large], Red], 
 Epilog -> {Thick, Purple, PointSize[Large] , Point[f /@ pts1], 
   Magenta, Point[f /@ pts2], 
   Cyan, Line /@ ({{# - 1/2, #2}, {# + 1/2, #2}} & @@@ (f /@ pts2)), 
   Orange, Line /@ ({{#, #2 - 1/2}, {#, #2 + 1/2}} & @@@ (f /@ pts1))}]
enter image description here

deleted 3 characters in body
Source Link
kglr
  • 400.5k
  • 18
  • 488
  • 929
f[x_] := Evaluate[yy {Cos[x], Sin[x]}]
tangent[x_] := Evaluate[Simplify@FrenetSerretSystem[f[x], x][[2, 1]]]

pts1 = N[x /. Solve[{Divide @@ tangent[x] == 0, 0 <= x <= 2 Pi}, x, Reals]]

{0.197395, 3.33898}

pts2 = N[x /. Solve[{Divide[#2, #1] & @@ tangent[x] == 0, 0 <= x <= 2 Pi}, x, Reals]]

{4.51499, 1.3734007}

epilog = {Text[Style[ToString[Round[#/Degree, .1]] <> "°", Black],
       {.1, .05} + (f@#)] & /@ Join[pts1, pts2], 
    Thick, Purple, PointSize[Large] , Point[f /@ pts1], 
    Magenta, Point[f /@ pts2], Green, Point[func[#]]Point[f[#]], 
    Cyan, Line /@ ({{# - 1/3, #2}, {# + 1/3, #2}} & @@@ (f /@ pts2)), 
    Orange, Line /@ ({{#, #2 - 1/3}, {#, #2 + 1/3}} & @@@ (f /@ pts1)), 
    Red, Line[{f[#] - .5 tangent[#], f[#] + .5 tangent[#]}]} &;

Manipulate[PolarPlot[yy, {x, 0, 2 Pi}, Epilog -> epilog[-t]], {t, 0, 2 Pi, Pi/100}]

enter image description here

Using OP's code with the option Epilog:

PolarPlot[yy, {x, 0, 2*Pi}, PolarAxes -> True, 
 PolarTicks -> {"Degrees", Automatic}, PolarGridLines -> True, 
 Mesh -> 15, MeshStyle -> Directive[PointSize[Large], Red], 
 Epilog -> {Thick, Purple, PointSize[Large] , Point[f /@ pts1], 
   Magenta, Point[f /@ pts2], 
   Cyan, Line /@ ({{# - 1/2, #2}, {# + 1/2, #2}} & @@@ (f /@ pts2)), 
   Orange, Line /@ ({{#, #2 - 1/2}, {#, #2 + 1/2}} & @@@ (f /@ pts1))}]

enter image description here

f[x_] := Evaluate[yy {Cos[x], Sin[x]}]
tangent[x_] := Evaluate[Simplify@FrenetSerretSystem[f[x], x][[2, 1]]]

pts1 = N[x /. Solve[{Divide @@ tangent[x] == 0, 0 <= x <= 2 Pi}, x, Reals]]

{0.197395, 3.33898}

pts2 = N[x /. Solve[{Divide[#2, #1] & @@ tangent[x] == 0, 0 <= x <= 2 Pi}, x, Reals]]

{4.51499, 1.3734007}

epilog = {Text[Style[ToString[Round[#/Degree, .1]] <> "°", Black],
       {.1, .05} + (f@#)] & /@ Join[pts1, pts2], 
    Thick, Purple, PointSize[Large] , Point[f /@ pts1], 
    Magenta, Point[f /@ pts2], Green, Point[func[#]], 
    Cyan, Line /@ ({{# - 1/3, #2}, {# + 1/3, #2}} & @@@ (f /@ pts2)), 
    Orange, Line /@ ({{#, #2 - 1/3}, {#, #2 + 1/3}} & @@@ (f /@ pts1)), 
    Red, Line[{f[#] - .5 tangent[#], f[#] + .5 tangent[#]}]} &;

Manipulate[PolarPlot[yy, {x, 0, 2 Pi}, Epilog -> epilog[-t]], {t, 0, 2 Pi, Pi/100}]

enter image description here

f[x_] := Evaluate[yy {Cos[x], Sin[x]}]
tangent[x_] := Evaluate[Simplify@FrenetSerretSystem[f[x], x][[2, 1]]]

pts1 = N[x /. Solve[{Divide @@ tangent[x] == 0, 0 <= x <= 2 Pi}, x, Reals]]

{0.197395, 3.33898}

pts2 = N[x /. Solve[{Divide[#2, #1] & @@ tangent[x] == 0, 0 <= x <= 2 Pi}, x, Reals]]

{4.51499, 1.3734007}

epilog = {Text[Style[ToString[Round[#/Degree, .1]] <> "°", Black],
       {.1, .05} + (f@#)] & /@ Join[pts1, pts2], 
    Thick, Purple, PointSize[Large] , Point[f /@ pts1], 
    Magenta, Point[f /@ pts2], Green, Point[f[#]], 
    Cyan, Line /@ ({{# - 1/3, #2}, {# + 1/3, #2}} & @@@ (f /@ pts2)), 
    Orange, Line /@ ({{#, #2 - 1/3}, {#, #2 + 1/3}} & @@@ (f /@ pts1)), 
    Red, Line[{f[#] - .5 tangent[#], f[#] + .5 tangent[#]}]} &;

Manipulate[PolarPlot[yy, {x, 0, 2 Pi}, Epilog -> epilog[-t]], {t, 0, 2 Pi, Pi/100}]

enter image description here

Using OP's code with the option Epilog:

PolarPlot[yy, {x, 0, 2*Pi}, PolarAxes -> True, 
 PolarTicks -> {"Degrees", Automatic}, PolarGridLines -> True, 
 Mesh -> 15, MeshStyle -> Directive[PointSize[Large], Red], 
 Epilog -> {Thick, Purple, PointSize[Large] , Point[f /@ pts1], 
   Magenta, Point[f /@ pts2], 
   Cyan, Line /@ ({{# - 1/2, #2}, {# + 1/2, #2}} & @@@ (f /@ pts2)), 
   Orange, Line /@ ({{#, #2 - 1/2}, {#, #2 + 1/2}} & @@@ (f /@ pts1))}]

enter image description here

added 121 characters in body
Source Link
kglr
  • 400.5k
  • 18
  • 488
  • 929
Loading
added 438 characters in body
Source Link
kglr
  • 400.5k
  • 18
  • 488
  • 929
Loading
Source Link
kglr
  • 400.5k
  • 18
  • 488
  • 929
Loading