added 184 characters in body
Source Link
Szabolcs
  • 236.5k
  • 31
  • 641
  • 1.3k

I had to deal with similar problems many times, and I usually do this with associations.

We start by defining an exhaustive list of grades in our desired order. I am not that familiar with the American grading system, so I might have gotten some parts of this wrong.

order = {"W", "E-", "E", "E+", "D-", "D", "D+", "C-", "C", "C+", "B-","B", "B+", "A-", "A", "A+"};

We are going to use this to reorder all our datasets. You can produce this list manually or automatically, then re-use it multiple times. In the application that I had, automatic sorting was not possible at all.

Now create the histogram as an association. We try to always work with associations.

hist = Counts[grades]
(* <|"C" -> 9, "B-" -> 5, "B" -> 11, "B+" -> 3, "C-" -> 4, 
 "E" -> 4, "D" -> 3, "D+" -> 2, "C+" -> 3, "A" -> 2, "D-" -> 1, 
 "W" -> 2|> *)

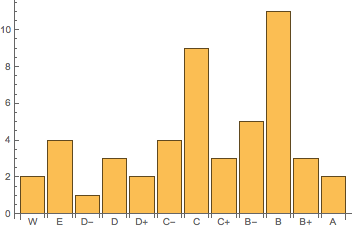
If you only want to keep those grades that actually appear in the dataset, do

BarChart[KeyTake[hist, order], ChartLabels -> Automatic]
Mathematica graphics

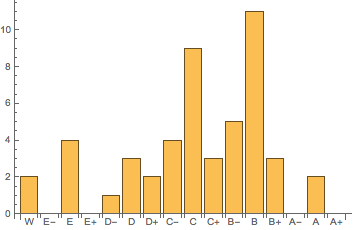
If you also want to keep grades whose count is 0,

BarChart[
 Join[AssociationThread[order, 0], hist],
 ChartLabels -> Automatic
]
Mathematica graphics

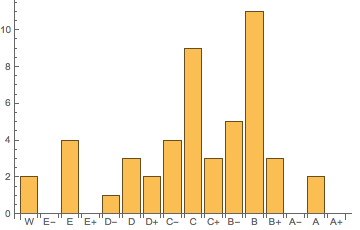
An alternative that is often useful:

BarChart[
 Lookup[hist, order, 0],
 ChartLabels -> order
]
Mathematica graphics

I had to deal with similar problems many times, and I usually do this with associations.

We start by defining an exhaustive list of grades in our desired order. I am not that familiar with the American grading system, so I might have gotten some parts of this wrong.

order = {"W", "E-", "E", "E+", "D-", "D", "D+", "C-", "C", "C+", "B-","B", "B+", "A-", "A", "A+"};

We are going to use this to reorder all our datasets. You can produce this list manually or automatically, then re-use it multiple times. In the application that I had, automatic sorting was not possible at all.

Now create the histogram as an association. We try to always work with associations.

hist = Counts[grades]
(* <|"C" -> 9, "B-" -> 5, "B" -> 11, "B+" -> 3, "C-" -> 4, 
 "E" -> 4, "D" -> 3, "D+" -> 2, "C+" -> 3, "A" -> 2, "D-" -> 1, 
 "W" -> 2|> *)

If you only want to keep those grades that actually appear in the dataset, do

BarChart[KeyTake[hist, order], ChartLabels -> Automatic]

Mathematica graphics

If you also want to keep grades whose count is 0,

BarChart[
 Join[AssociationThread[order, 0], hist],
 ChartLabels -> Automatic
]

Mathematica graphics

An alternative that is often useful:

BarChart[
 Lookup[hist, order, 0],
 ChartLabels -> order
]

Mathematica graphics

Source Link
Szabolcs
  • 236.5k
  • 31
  • 641
  • 1.3k

I had to deal with similar problems many times, and I usually do this with associations.

We start by defining an exhaustive list of grades in our desired order. I am not that familiar with the American grading system, so I might have gotten some parts of this wrong.

order = {"W", "E-", "E", "E+", "D-", "D", "D+", "C-", "C", "C+", "B-","B", "B+", "A-", "A", "A+"};

We are going to use this to reorder all our datasets. You can produce this list manually or automatically, then re-use it multiple times. In the application that I had, automatic sorting was not possible at all.

Now create the histogram as an association. We try to always work with associations.

hist = Counts[grades]
(* <|"C" -> 9, "B-" -> 5, "B" -> 11, "B+" -> 3, "C-" -> 4, 
 "E" -> 4, "D" -> 3, "D+" -> 2, "C+" -> 3, "A" -> 2, "D-" -> 1, 
 "W" -> 2|> *)

If you only want to keep those grades that actually appear in the dataset, do

BarChart[KeyTake[hist, order], ChartLabels -> Automatic]

Mathematica graphics

If you also want to keep grades whose count is 0,

BarChart[
 Join[AssociationThread[order, 0], hist],
 ChartLabels -> Automatic
]

Mathematica graphics