edited body
Source Link
Pillsy
  • 18.6k
  • 2
  • 48
  • 94

This is a great use for the Association data structure, which makes so many tasks in Mathematica that much more pleasant.

First, we can just write out a ranking of grades:

ranking = {"A+", "A", "A-", "B+", "B", "B-", "C+", "C", "C-", "D+", 
  "D", "D-", "E", "W"};

Then we take your grades and count how many of each there are into an association with Counts:

grades = {"C", "B-", "B", "B+", "B", "C-", "E", "B", "D", "D+", "C-", 
  "B", "C", "B-", "C+", "E", "B-", "B-", "C-", "A", "C", "B-", "B", 
  "C+", "B", "C", "B+", "C+", "D-", "C", "A", "E", "B", "B+", "C", 
  "C", "D+", "D", "C", "C-", "C", "B", "D", "B", "B", "E", "B", "W", 
  "W"};

counts = Counts[grades]
(* <|"C" -> 9, "B-" -> 5, "B" -> 11, "B+" -> 3, "C-" -> 4, "E" -> 4, 
     "D" -> 3, "D+" -> 2, "C+" -> 3, "A" -> 2, "D-" -> 1, "W" -> 2|> *)

This is a table associating each grades with its counts, but it's anin a useless order. Let's put it in the order you want, using KeyTake, which we can pass directly to BarChart, which can Automaticly figure out the labels:

ordered = KeyTake[Counts[grades], Reverse@ranking]
(* <|"W" -> 2, "E" -> 4, "D-" -> 1, "D" -> 3, "D+" -> 2, "C-" -> 4, 
     "C" -> 9, "C+" -> 3, "B-" -> 5, "B" -> 11, "B+" -> 3, "A" -> 2|> *)

BarChart[ordered, ChartLabels -> Automatic]

bar chart

This is a great use for the Association data structure, which makes so many tasks in Mathematica that much more pleasant.

First, we can just write out a ranking of grades:

ranking = {"A+", "A", "A-", "B+", "B", "B-", "C+", "C", "C-", "D+", 
  "D", "D-", "E", "W"};

Then we take your grades and count how many of each there are into an association with Counts:

grades = {"C", "B-", "B", "B+", "B", "C-", "E", "B", "D", "D+", "C-", 
  "B", "C", "B-", "C+", "E", "B-", "B-", "C-", "A", "C", "B-", "B", 
  "C+", "B", "C", "B+", "C+", "D-", "C", "A", "E", "B", "B+", "C", 
  "C", "D+", "D", "C", "C-", "C", "B", "D", "B", "B", "E", "B", "W", 
  "W"};

counts = Counts[grades]
(* <|"C" -> 9, "B-" -> 5, "B" -> 11, "B+" -> 3, "C-" -> 4, "E" -> 4, 
     "D" -> 3, "D+" -> 2, "C+" -> 3, "A" -> 2, "D-" -> 1, "W" -> 2|> *)

This is a table associating each grades with its counts, but it's an a useless order. Let's put it in the order you want, using KeyTake, which we can pass directly to BarChart, which can Automaticly figure out the labels:

ordered = KeyTake[Counts[grades], Reverse@ranking]
(* <|"W" -> 2, "E" -> 4, "D-" -> 1, "D" -> 3, "D+" -> 2, "C-" -> 4, 
     "C" -> 9, "C+" -> 3, "B-" -> 5, "B" -> 11, "B+" -> 3, "A" -> 2|> *)

BarChart[ordered, ChartLabels -> Automatic]
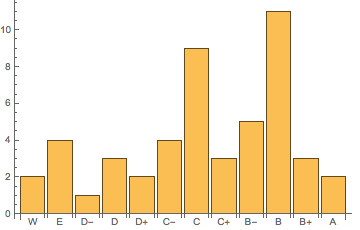
bar chart

This is a great use for the Association data structure, which makes so many tasks in Mathematica that much more pleasant.

First, we can just write out a ranking of grades:

ranking = {"A+", "A", "A-", "B+", "B", "B-", "C+", "C", "C-", "D+", 
  "D", "D-", "E", "W"};

Then we take your grades and count how many of each there are into an association with Counts:

grades = {"C", "B-", "B", "B+", "B", "C-", "E", "B", "D", "D+", "C-", 
  "B", "C", "B-", "C+", "E", "B-", "B-", "C-", "A", "C", "B-", "B", 
  "C+", "B", "C", "B+", "C+", "D-", "C", "A", "E", "B", "B+", "C", 
  "C", "D+", "D", "C", "C-", "C", "B", "D", "B", "B", "E", "B", "W", 
  "W"};

counts = Counts[grades]
(* <|"C" -> 9, "B-" -> 5, "B" -> 11, "B+" -> 3, "C-" -> 4, "E" -> 4, 
     "D" -> 3, "D+" -> 2, "C+" -> 3, "A" -> 2, "D-" -> 1, "W" -> 2|> *)

This is a table associating each grades with its counts, but it's in a useless order. Let's put it in the order you want, using KeyTake, which we can pass directly to BarChart, which can Automaticly figure out the labels:

ordered = KeyTake[Counts[grades], Reverse@ranking]
(* <|"W" -> 2, "E" -> 4, "D-" -> 1, "D" -> 3, "D+" -> 2, "C-" -> 4, 
     "C" -> 9, "C+" -> 3, "B-" -> 5, "B" -> 11, "B+" -> 3, "A" -> 2|> *)

BarChart[ordered, ChartLabels -> Automatic]

bar chart

Source Link
Pillsy
  • 18.6k
  • 2
  • 48
  • 94

This is a great use for the Association data structure, which makes so many tasks in Mathematica that much more pleasant.

First, we can just write out a ranking of grades:

ranking = {"A+", "A", "A-", "B+", "B", "B-", "C+", "C", "C-", "D+", 
  "D", "D-", "E", "W"};

Then we take your grades and count how many of each there are into an association with Counts:

grades = {"C", "B-", "B", "B+", "B", "C-", "E", "B", "D", "D+", "C-", 
  "B", "C", "B-", "C+", "E", "B-", "B-", "C-", "A", "C", "B-", "B", 
  "C+", "B", "C", "B+", "C+", "D-", "C", "A", "E", "B", "B+", "C", 
  "C", "D+", "D", "C", "C-", "C", "B", "D", "B", "B", "E", "B", "W", 
  "W"};

counts = Counts[grades]
(* <|"C" -> 9, "B-" -> 5, "B" -> 11, "B+" -> 3, "C-" -> 4, "E" -> 4, 
     "D" -> 3, "D+" -> 2, "C+" -> 3, "A" -> 2, "D-" -> 1, "W" -> 2|> *)

This is a table associating each grades with its counts, but it's an a useless order. Let's put it in the order you want, using KeyTake, which we can pass directly to BarChart, which can Automaticly figure out the labels:

ordered = KeyTake[Counts[grades], Reverse@ranking]
(* <|"W" -> 2, "E" -> 4, "D-" -> 1, "D" -> 3, "D+" -> 2, "C-" -> 4, 
     "C" -> 9, "C+" -> 3, "B-" -> 5, "B" -> 11, "B+" -> 3, "A" -> 2|> *)

BarChart[ordered, ChartLabels -> Automatic]

bar chart