deleted 20 characters in body
Source Link
kglr
  • 400.5k
  • 18
  • 488
  • 929

You can post-process the ErrorListPlot output to reverse the vertical axis using ReflectionTransform and modify the ticks:

elp = ErrorListPlot[data];
Show[MapAt[GeometricTransformation[#, ReflectionTransform[{0, -1}]] &, 
  ErrorListPlot[data]elp, {1}], 
 PlotRange -> {1.8, 2.3}, AxesOrigin -> {Automatic, 2.3}, 
 Ticks -> {Automatic, Charting`FindTicks[{0, 1}, {0, -1}] }]

enter image description here

Alternatively,

Show[ErrorListPlot[data]Show[elp /. p : _Point |_Point| _Line :> 
   GeometricTransformation[p, ReflectionTransform[{0, -1}]], 
 PlotRange -> {1.8, 2.3}, AxesOrigin -> {Automatic, 2.3}, 
 Ticks -> {Automatic, Charting`FindTicks[{0, 1}, {0, -1}] } ]

same picture

You can post-process the ErrorListPlot output to reverse the vertical axis using ReflectionTransform and modify the ticks:

 Show[MapAt[GeometricTransformation[#, ReflectionTransform[{0, -1}]] &, 
  ErrorListPlot[data], {1}], 
 PlotRange -> {1.8, 2.3}, AxesOrigin -> {Automatic, 2.3}, 
 Ticks -> {Automatic, Charting`FindTicks[{0, 1}, {0, -1}] }]

enter image description here

Alternatively,

Show[ErrorListPlot[data] /. p : _Point | _Line :> 
   GeometricTransformation[p, ReflectionTransform[{0, -1}]], 
 PlotRange -> {1.8, 2.3}, AxesOrigin -> {Automatic, 2.3}, 
 Ticks -> {Automatic, Charting`FindTicks[{0, 1}, {0, -1}] } ]

same picture
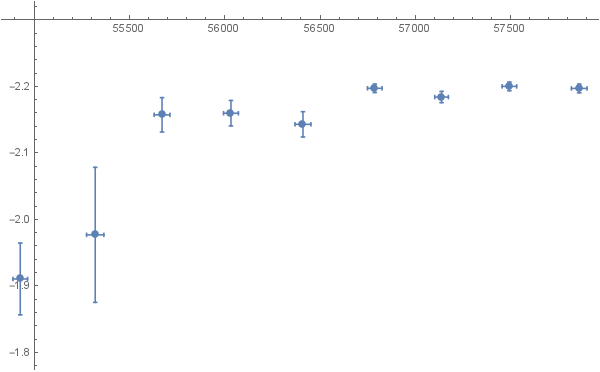
You can post-process the ErrorListPlot output to reverse the vertical axis using ReflectionTransform and modify the ticks:

elp = ErrorListPlot[data];
Show[MapAt[GeometricTransformation[#, ReflectionTransform[{0, -1}]] &, elp, {1}], 
 PlotRange -> {1.8, 2.3}, AxesOrigin -> {Automatic, 2.3}, 
 Ticks -> {Automatic, Charting`FindTicks[{0, 1}, {0, -1}] }]

enter image description here

Alternatively,

Show[elp /. p : _Point| _Line :> GeometricTransformation[p, ReflectionTransform[{0, -1}]],
 PlotRange -> {1.8, 2.3}, AxesOrigin -> {Automatic, 2.3}, 
 Ticks -> {Automatic, Charting`FindTicks[{0, 1}, {0, -1}] } ]

same picture

added 290 characters in body
Source Link
kglr
  • 400.5k
  • 18
  • 488
  • 929

You can post-process the ErrorListPlot output to reverse the vertical axis using ReflectionTransform and modify the ticks:

 Show[MapAt[GeometricTransformation[#, ReflectionTransform[{0, -1}]] &, 
  ErrorListPlot[data], {1}], 
 PlotRange -> {1.8, 2.3}, AxesOrigin -> {Automatic, 2.3}, 
 Ticks -> {Automatic, Charting`FindTicks[{0, 1}, {0, -1}] }]

enter image description here

Alternatively,

Show[ErrorListPlot[data] /. p : _Point | _Line :> 
   GeometricTransformation[p, ReflectionTransform[{0, -1}]], 
 PlotRange -> {1.8, 2.3}, AxesOrigin -> {Automatic, 2.3}, 
 Ticks -> {Automatic, Charting`FindTicks[{0, 1}, {0, -1}] } ]

same picture

You can post-process the ErrorListPlot output to reverse the vertical axis using ReflectionTransform and modify the ticks:

 Show[MapAt[GeometricTransformation[#, ReflectionTransform[{0, -1}]] &, 
  ErrorListPlot[data], {1}], 
 PlotRange -> {1.8, 2.3}, AxesOrigin -> {Automatic, 2.3}, 
 Ticks -> {Automatic, Charting`FindTicks[{0, 1}, {0, -1}] }]

enter image description here

Alternatively,

Show[ErrorListPlot[data] /. p : _Point | _Line :> 
   GeometricTransformation[p, ReflectionTransform[{0, -1}]], 
 PlotRange -> {1.8, 2.3}, AxesOrigin -> {Automatic, 2.3}, 
 Ticks -> {Automatic, Charting`FindTicks[{0, 1}, {0, -1}] } ]

same picture

Source Link
kglr
  • 400.5k
  • 18
  • 488
  • 929

You can post-process the ErrorListPlot output to reverse the vertical axis using ReflectionTransform and modify the ticks:

 Show[MapAt[GeometricTransformation[#, ReflectionTransform[{0, -1}]] &, 
  ErrorListPlot[data], {1}], 
 PlotRange -> {1.8, 2.3}, AxesOrigin -> {Automatic, 2.3}, 
 Ticks -> {Automatic, Charting`FindTicks[{0, 1}, {0, -1}] }]

enter image description here