added 174 characters in body
Source Link
kglr
  • 400.5k
  • 18
  • 488
  • 929

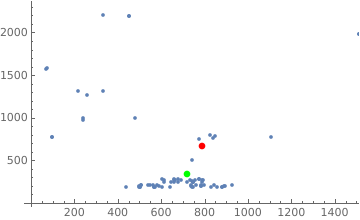
One possible way to operationalize the requirement "When the point in the denser area, it has greater weight" is to weight each point by the number of neighbors within a specified distance:

nf = Nearest[pts];
radius = 50;
weightedData = WeightedData[pts, Length[nf[#, {All, radius}]] & /@ pts];
center = Mean[weightedData];
ListPlot[pts, Epilog -> {Red, PointSize[.02], Point[Mean[pts]], Green, Point @ center}]

enter image description here

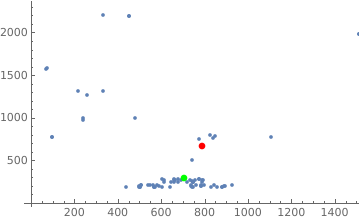
With radius = 100 we get

enter image description here

One possible way:

nf = Nearest[pts];
radius = 50;
weightedData = WeightedData[pts, Length[nf[#, {All, radius}]] & /@ pts];
center = Mean[weightedData];
ListPlot[pts, Epilog -> {Red, PointSize[.02], Point[Mean[pts]], Green, Point @ center}]

enter image description here

With radius = 100 we get

enter image description here

One possible way to operationalize the requirement "When the point in the denser area, it has greater weight" is to weight each point by the number of neighbors within a specified distance:

nf = Nearest[pts];
radius = 50;
weightedData = WeightedData[pts, Length[nf[#, {All, radius}]] & /@ pts];
center = Mean[weightedData];
ListPlot[pts, Epilog -> {Red, PointSize[.02], Point[Mean[pts]], Green, Point @ center}]

enter image description here

With radius = 100 we get

enter image description here

Source Link
kglr
  • 400.5k
  • 18
  • 488
  • 929

One possible way:

nf = Nearest[pts];
radius = 50;
weightedData = WeightedData[pts, Length[nf[#, {All, radius}]] & /@ pts];
center = Mean[weightedData];
ListPlot[pts, Epilog -> {Red, PointSize[.02], Point[Mean[pts]], Green, Point @ center}]

enter image description here

With radius = 100 we get

enter image description here