Add a few more examples
Source Link
Carl Woll
  • 131.7k
  • 6
  • 246
  • 359

Here is another approach using EntityValue. The countries:

countries = Map[
    Entity["Country",#]&,
    {"France","Germany","Spain","Russia","Portugal","Poland"}
];

Using EntityValue:

interval = Interval[{DateObject[{1999}], DateObject[{2008}]}];

dataset = EntityValue[
    countries,
    {
    EntityProperty["Country","GDP",{"Date"->interval}],
    EntityProperty["Country","Population",{"Date"->interval}]
    },
    "Dataset"
];

The dataset contains the information you want, although the values are encoded in TimeSeries/TemporalData objects. For instance:

ts = dataset[[1,1]];
Head @ ts

TemporalData

To extract values from a TimeSeries/TemporalData object you give it the date you are interested in:

ts[DateObject[{2004}]]

Quantity[2.12411*10^12, ("USDollars")/("Years"), {}]

So, to obtain the population of Russia in 2004:

dataset[Entity["Country", "Russia"], 2, #[DateObject[{2004}]]&]

Quantity[144306982, "People", {}]

Or, the average GDP for all of the countries for the year 2002:

dataset[Mean, 1, #[DateObject[{2002}]]&]

Quantity[8.27107*10^11, ("USDollars")/("Years")]

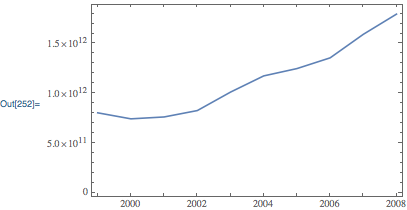
Plot of the average GDP from 1999 to 2008:

dataset[DateListPlot @* Mean, 1]

enter image description here

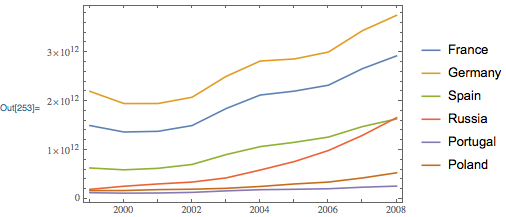
Plot of the GDP for each country from 1999 to 2008:

dataset[DateListPlot,1]

enter image description here

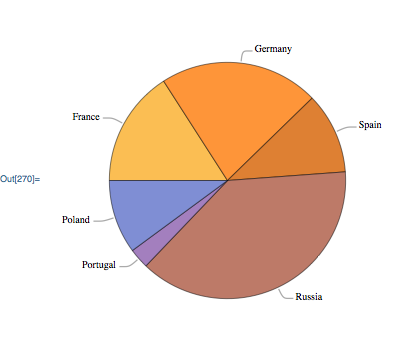
Distribution of population in the year 2003:

PieChart[
    dataset[All, 2, #[DateObject[{2003}]]&],
    ChartLabels->Callout[Automatic]
]

enter image description here

Here is another approach using EntityValue. The countries:

countries = Map[
    Entity["Country",#]&,
    {"France","Germany","Spain","Russia","Portugal","Poland"}
];

Using EntityValue:

interval = Interval[{DateObject[{1999}], DateObject[{2008}]}];

dataset = EntityValue[
    countries,
    {
    EntityProperty["Country","GDP",{"Date"->interval}],
    EntityProperty["Country","Population",{"Date"->interval}]
    },
    "Dataset"
];

The dataset contains the information you want, although the values are encoded in TimeSeries/TemporalData objects. For instance:

ts = dataset[[1,1]];
Head @ ts

TemporalData

To extract values from a TimeSeries/TemporalData object you give it the date you are interested in:

ts[DateObject[{2004}]]

Quantity[2.12411*10^12, ("USDollars")/("Years"), {}]

So, to obtain the population of Russia in 2004:

dataset[Entity["Country", "Russia"], 2, #[DateObject[{2004}]]&]

Quantity[144306982, "People", {}]

Or, the average GDP for all of the countries for the year 2002:

dataset[Mean, 1, #[DateObject[{2002}]]&]

Quantity[8.27107*10^11, ("USDollars")/("Years")]

Plot of the average GDP from 1999 to 2008:

dataset[DateListPlot @* Mean, 1]

enter image description here

Plot of the GDP for each country from 1999 to 2008:

dataset[DateListPlot,1]

enter image description here

Distribution of population in the year 2003:

PieChart[
    dataset[All, 2, #[DateObject[{2003}]]&],
    ChartLabels->Callout[Automatic]
]
enter image description here

Source Link
Carl Woll
  • 131.7k
  • 6
  • 246
  • 359

Here is another approach using EntityValue. The countries:

countries = Map[
    Entity["Country",#]&,
    {"France","Germany","Spain","Russia","Portugal","Poland"}
];

Using EntityValue:

interval = Interval[{DateObject[{1999}], DateObject[{2008}]}];

dataset = EntityValue[
    countries,
    {
    EntityProperty["Country","GDP",{"Date"->interval}],
    EntityProperty["Country","Population",{"Date"->interval}]
    },
    "Dataset"
];

The dataset contains the information you want, although the values are encoded in TimeSeries/TemporalData objects. For instance:

ts = dataset[[1,1]];
Head @ ts

TemporalData

To extract values from a TimeSeries/TemporalData object you give it the date you are interested in:

ts[DateObject[{2004}]]

Quantity[2.12411*10^12, ("USDollars")/("Years"), {}]

So, to obtain the population of Russia in 2004:

dataset[Entity["Country", "Russia"], 2, #[DateObject[{2004}]]&]

Quantity[144306982, "People", {}]

Or, the average GDP for all of the countries for the year 2002:

dataset[Mean, 1, #[DateObject[{2002}]]&]

Quantity[8.27107*10^11, ("USDollars")/("Years")]