added 108 characters in body
Source Link
OkkesDulgerci
  • 10.9k
  • 1
  • 19
  • 40

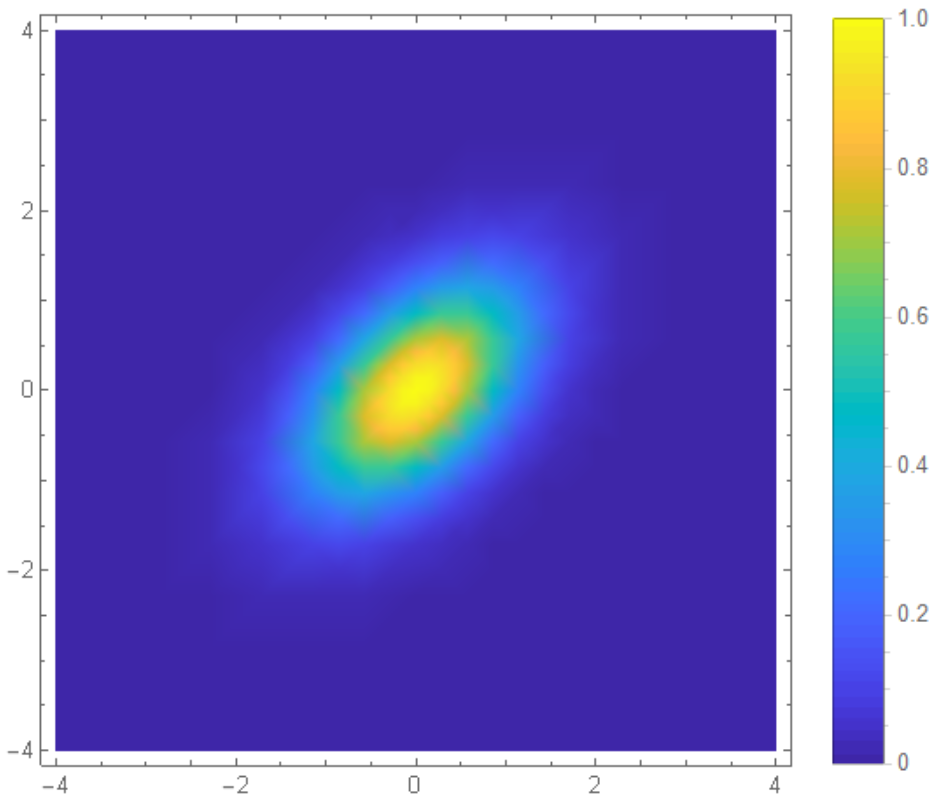
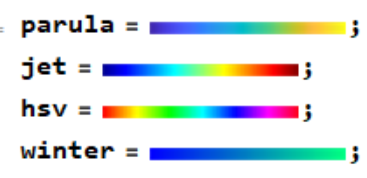
We can use color data from legend. Go to https://www.mathworks.com/help/matlab/ref/colormap.html and copy the legend and put it in Mathematica

enter image description here

colorName = {parula, jet, hsv, winter};

{col, row} = ImageDimensions /@ colorName // First;

ParulaMMA = 
  Module[{colorlist}, 
   colorlist = 
    Catenate@
     ImageData@ImageTake[parula, {Round[row/2], Round[row/2]}, All];
   Evaluate[Blend[RGBColor @@@ colorlist, #] &]];

JetMMA = Module[{colorlist}, 
   colorlist = 
    Catenate@
     ImageData@ImageTake[jet, {Round[row/2], Round[row/2]}, All];
   Evaluate[Blend[RGBColor @@@ colorlist, #] &]];

HsvMMA = Module[{colorlist}, 
   colorlist = 
    Catenate@
     ImageData@ImageTake[hsv, {Round[row/2], Round[row/2]}, All];
   Evaluate[Blend[RGBColor @@@ colorlist, #] &]];

WinterMMA = 
  Module[{colorlist}, 
   colorlist = 
    Catenate@
     ImageData@ImageTake[winter, {Round[row/2], Round[row/2]}, All];
   Evaluate[Blend[RGBColor @@@ colorlist, #] &]];   

DensityPlot[Cos[x] 
 Sin[y]Legended[DensityPlot[Exp[-(x^2 + y^2) + y*x], {x, -104, 104}, {y, -104, 104}, 
    PlotRange -> All, ColorFunction -> #, PlotPoints -> 100, 
   PlotLegends ImageSize -> Automatic220], ImageSizeBarLegend[{#, ->{0, 200]1}}]] & /@ {ParulaMMA, 
  JetMMA, HsvMMA, WinterMMA}

enter image description hereenter image description here

enter image description here

We can use color data from legend. Go to https://www.mathworks.com/help/matlab/ref/colormap.html and copy the legend and put it in Mathematica

enter image description here

colorName = {parula, jet, hsv, winter};

{col, row} = ImageDimensions /@ colorName // First;

ParulaMMA = 
  Module[{colorlist}, 
   colorlist = 
    Catenate@
     ImageData@ImageTake[parula, {Round[row/2], Round[row/2]}, All];
   Evaluate[Blend[RGBColor @@@ colorlist, #] &]];

JetMMA = Module[{colorlist}, 
   colorlist = 
    Catenate@
     ImageData@ImageTake[jet, {Round[row/2], Round[row/2]}, All];
   Evaluate[Blend[RGBColor @@@ colorlist, #] &]];

HsvMMA = Module[{colorlist}, 
   colorlist = 
    Catenate@
     ImageData@ImageTake[hsv, {Round[row/2], Round[row/2]}, All];
   Evaluate[Blend[RGBColor @@@ colorlist, #] &]];

WinterMMA = 
  Module[{colorlist}, 
   colorlist = 
    Catenate@
     ImageData@ImageTake[winter, {Round[row/2], Round[row/2]}, All];
   Evaluate[Blend[RGBColor @@@ colorlist, #] &]];

DensityPlot[Cos[x] Sin[y], {x, -10, 10}, {y, -10, 10}, 
   PlotRange -> All, ColorFunction -> #, PlotPoints -> 100, 
   PlotLegends -> Automatic, ImageSize -> 200] & /@ {ParulaMMA, 
  JetMMA, HsvMMA, WinterMMA}
enter image description here

We can use color data from legend. Go to https://www.mathworks.com/help/matlab/ref/colormap.html and copy the legend and put it in Mathematica

enter image description here

colorName = {parula, jet, hsv, winter};

{col, row} = ImageDimensions /@ colorName // First;

ParulaMMA = 
  Module[{colorlist}, 
   colorlist = 
    Catenate@
     ImageData@ImageTake[parula, {Round[row/2], Round[row/2]}, All];
   Evaluate[Blend[RGBColor @@@ colorlist, #] &]];

JetMMA = Module[{colorlist}, 
   colorlist = 
    Catenate@
     ImageData@ImageTake[jet, {Round[row/2], Round[row/2]}, All];
   Evaluate[Blend[RGBColor @@@ colorlist, #] &]];

HsvMMA = Module[{colorlist}, 
   colorlist = 
    Catenate@
     ImageData@ImageTake[hsv, {Round[row/2], Round[row/2]}, All];
   Evaluate[Blend[RGBColor @@@ colorlist, #] &]];

WinterMMA = 
  Module[{colorlist}, 
   colorlist = 
    Catenate@
     ImageData@ImageTake[winter, {Round[row/2], Round[row/2]}, All];
   Evaluate[Blend[RGBColor @@@ colorlist, #] &]];   

 
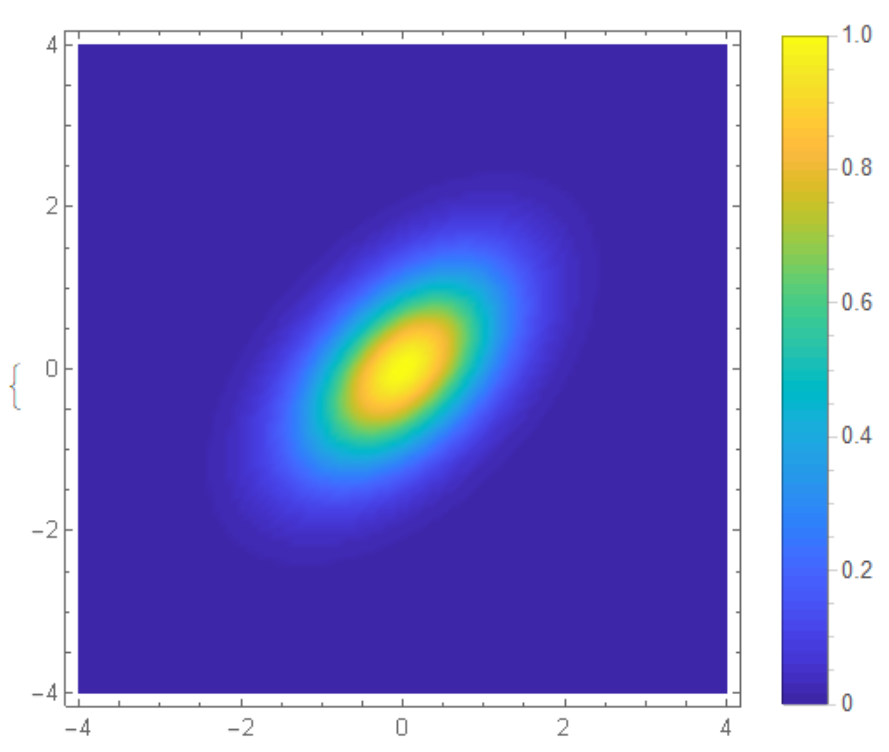
 Legended[DensityPlot[Exp[-(x^2 + y^2) + y*x], {x, -4, 4}, {y, -4, 4}, 
    PlotRange -> All, ColorFunction -> #, PlotPoints -> 100, 
    ImageSize -> 220], BarLegend[{#, {0, 1}}]] & /@ {ParulaMMA, 
  JetMMA, HsvMMA, WinterMMA}

enter image description here

enter image description here

improved
Source Link
OkkesDulgerci
  • 10.9k
  • 1
  • 19
  • 40

I think weWe can use color data from legend. CropGo to https://www.mathworks.com/help/matlab/ref/colormap.html and copy the legend and and put it in mathematica andadefine as im=Mathematica

enter image description hereenter image description here

im=putcolorName the= image{parula, ofjet, legendhsv, here;winter};

{col, row} = ImageDimensions[im];ImageDimensions /@ colorName // First;

colorBarParulaMMA = ImageTake[im
  Module[{colorlist}, All
   colorlist = 
    Catenate@
     ImageData@ImageTake[parula, {Round[colRound[row/2], Round[colRound[row/2]}, +All];
 1  Evaluate[Blend[RGBColor @@@ colorlist, #] &]];

JetMMA = Module[{colorlist}];, 
   colorlist = 
myColor[x_] :   Catenate@
     ImageData@ImageTake[jet, {Round[row/2], Round[row/2]}, All];
   Evaluate[Blend[RGBColor @@@ colorlist, #] &]];

HsvMMA = Module[{colorlist}, 
  Blend[RGBColor colorlist = 
    Catenate@
     ImageData@ImageTake[hsv, {Round[row/2], Round[row/2]}, All];
   Evaluate[Blend[RGBColor @@@ Reverse@Catenate@ImageData[colorBar]colorlist, x];#] &]];

DensityPlot[Exp[-(x^2WinterMMA += y^2) 
 + y*x]Module[{colorlist}, 
   colorlist = 
    Catenate@
     ImageData@ImageTake[winter, {Round[row/2], Round[row/2]}, All];
   Evaluate[Blend[RGBColor @@@ colorlist, #] &]];

DensityPlot[Cos[x] Sin[y], {x, -410, 410}, {y, -410, 410}, 
 PlotLegends  PlotRange -> AutomaticAll, ColorFunction -> myColor#, PlotPoints -> 100, 
 ColorFunctionScaling  PlotLegends -> TrueAutomatic, PlotRangeImageSize -> All]200] & /@ {ParulaMMA, 
  JetMMA, HsvMMA, WinterMMA}

enter image description hereenter image description here

I think we can use color data from legend. Crop the legend and put in mathematica andadefine as im=

enter image description here

im=put the image of legend here;
{col, row} = ImageDimensions[im];

colorBar = ImageTake[im, All, {Round[col/2], Round[col/2] + 1}];

myColor[x_] := 
  Blend[RGBColor @@@ Reverse@Catenate@ImageData[colorBar], x];

DensityPlot[Exp[-(x^2 + y^2) + y*x], {x, -4, 4}, {y, -4, 4}, 
 PlotLegends -> Automatic, ColorFunction -> myColor, 
 ColorFunctionScaling -> True, PlotRange -> All]

enter image description here

We can use color data from legend. Go to https://www.mathworks.com/help/matlab/ref/colormap.html and copy the legend and put it in Mathematica

enter image description here

colorName = {parula, jet, hsv, winter};

{col, row} = ImageDimensions /@ colorName // First;

ParulaMMA = 
  Module[{colorlist}, 
   colorlist = 
    Catenate@
     ImageData@ImageTake[parula, {Round[row/2], Round[row/2]}, All];
   Evaluate[Blend[RGBColor @@@ colorlist, #] &]];

JetMMA = Module[{colorlist}, 
   colorlist = 
    Catenate@
     ImageData@ImageTake[jet, {Round[row/2], Round[row/2]}, All];
   Evaluate[Blend[RGBColor @@@ colorlist, #] &]];

HsvMMA = Module[{colorlist}, 
   colorlist = 
    Catenate@
     ImageData@ImageTake[hsv, {Round[row/2], Round[row/2]}, All];
   Evaluate[Blend[RGBColor @@@ colorlist, #] &]];

WinterMMA =  
  Module[{colorlist}, 
   colorlist = 
    Catenate@
     ImageData@ImageTake[winter, {Round[row/2], Round[row/2]}, All];
   Evaluate[Blend[RGBColor @@@ colorlist, #] &]];

DensityPlot[Cos[x] Sin[y], {x, -10, 10}, {y, -10, 10}, 
   PlotRange -> All, ColorFunction -> #, PlotPoints -> 100, 
   PlotLegends -> Automatic, ImageSize -> 200] & /@ {ParulaMMA, 
  JetMMA, HsvMMA, WinterMMA}
enter image description here

Source Link
OkkesDulgerci
  • 10.9k
  • 1
  • 19
  • 40

I think we can use color data from legend. Crop the legend and put in mathematica andadefine as im=

enter image description here

im=put the image of legend here;
{col, row} = ImageDimensions[im];

colorBar = ImageTake[im, All, {Round[col/2], Round[col/2] + 1}];

myColor[x_] := 
  Blend[RGBColor @@@ Reverse@Catenate@ImageData[colorBar], x];

DensityPlot[Exp[-(x^2 + y^2) + y*x], {x, -4, 4}, {y, -4, 4}, 
 PlotLegends -> Automatic, ColorFunction -> myColor, 
 ColorFunctionScaling -> True, PlotRange -> All]

enter image description here