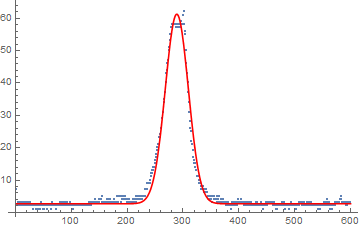
It would be helpful if you mention something about the source and structure of the data. For example, the "y" values are all integers. Are these frequency counts? Or are they discrete measurements at each of the 600 "x" values?
If the "y" values are frequencies and you are trying to fit a normal distribution, then all you need to do is find the mean and standard deviation of the data. (However, you definitely don't have samples from a normal distribution. Maybe samples from a normal distribution contaminated with a discrete uniform distribution.)
If the "y" values are measurements, then you want to perform a regression (rather than fitting a probability distribution with implied sampling properties) that just happens to have a similar shape to a normal probability density function.
A curve following a normal probability function will drop to zero quickly and your data does not support that. What you can do is add another parameter that raises the curve a bit to get a more appropriate regression fit.
Below I've re-parameterized such a curve to avoid any hint that there might be random sampling properties implied (i.e., no mean and standard deviation) under the assumption that this is a regression problem.
y = {7, 7, 2, 2, 2, 3, 2, 3, 2, 2, 3, 2, 2, 2, 3, 2, 3, 3, 2, 3, 3, 3,
    2, 3, 3, 3, 2, 2, 2, 2, 2, 1, 2, 2, 2, 2, 1, 2, 2, 1, 1, 1, 2, 1,
   2, 2, 3, 2, 2, 1, 2, 1, 2, 2, 2, 2, 1, 2, 2, 2, 2, 2, 2, 2, 1, 3,
   2, 2, 2, 2, 2, 2, 1, 2, 2, 2, 2, 2, 2, 2, 3, 2, 2, 3, 3, 2, 2, 3,
   3, 2, 2, 2, 3, 3, 2, 2, 2, 3, 3, 2, 2, 2, 1, 1, 2, 2, 2, 2, 2, 2,
   2, 2, 2, 2, 2, 2, 2, 2, 2, 2, 2, 2, 2, 2, 2, 2, 2, 2, 2, 2, 2, 2,
   3, 2, 3, 3, 2, 3, 3, 3, 3, 3, 4, 4, 3, 3, 3, 3, 3, 4, 3, 4, 4, 4,
   3, 5, 3, 3, 3, 3, 3, 3, 3, 3, 4, 3, 4, 3, 4, 3, 4, 3, 3, 3, 3, 3,
   3, 4, 3, 3, 3, 5, 5, 3, 5, 5, 5, 5, 5, 3, 4, 5, 5, 4, 5, 4, 5, 4,
   4, 4, 3, 4, 3, 3, 4, 3, 3, 3, 3, 3, 3, 4, 3, 3, 4, 3, 5, 4, 5, 4,
   5, 4, 4, 5, 5, 5, 5, 4, 5, 5, 5, 5, 7, 7, 7, 7, 9, 9, 9, 9, 9, 10,
   12, 11, 12, 13, 13, 14, 14, 15, 16, 17, 18, 19, 20, 21, 21, 23, 23,
    24, 26, 26, 29, 29, 31, 34, 35, 37, 37, 40, 43, 44, 46, 47, 50,
   51, 53, 55, 55, 57, 57, 58, 58, 58, 58, 58, 58, 58, 57, 57, 57, 58,
    57, 57, 57, 58, 59, 59, 58, 61, 61, 62, 58, 56, 55, 50, 46, 43,
   40, 37, 34, 31, 28, 26, 25, 22, 21, 19, 17, 16, 15, 15, 14, 13, 13,
    11, 11, 11, 10, 9, 9, 9, 8, 7, 7, 8, 7, 7, 6, 6, 6, 7, 6, 6, 5, 5,
    5, 5, 5, 4, 4, 5, 3, 5, 5, 4, 5, 4, 4, 4, 5, 3, 4, 3, 5, 3, 3, 3,
   4, 4, 3, 4, 3, 3, 3, 3, 3, 2, 2, 3, 3, 2, 2, 2, 2, 1, 2, 3, 2, 3,
   2, 3, 2, 2, 3, 3, 2, 3, 4, 3, 3, 3, 3, 4, 3, 3, 3, 3, 3, 3, 2, 2,
   3, 3, 2, 2, 3, 2, 3, 3, 2, 3, 2, 2, 2, 2, 2, 2, 2, 2, 2, 3, 3, 2,
   2, 2, 2, 2, 2, 2, 3, 2, 2, 1, 2, 2, 2, 2, 2, 3, 2, 2, 3, 3, 3, 3,
   3, 3, 3, 3, 3, 2, 2, 3, 2, 2, 2, 1, 1, 2, 2, 2, 2, 2, 2, 2, 2, 3,
   2, 2, 3, 2, 2, 1, 2, 2, 2, 2, 2, 1, 2, 2, 2, 3, 2, 2, 2, 2, 2, 2,
   2, 2, 1, 2, 2, 2, 2, 2, 3, 3, 3, 3, 3, 2, 3, 3, 2, 3, 2, 2, 2, 2,
   3, 3, 2, 2, 3, 2, 3, 3, 2, 2, 2, 2, 2, 2, 2, 2, 2, 2, 2, 1, 2, 2,
   2, 2, 1, 2, 2, 2, 2, 2, 3, 2, 2, 3, 3, 2, 4, 2, 3, 3, 2, 1, 2, 2,
   1, 2, 2, 2, 2, 2, 2, 3, 3, 3, 3, 3, 3, 3, 3, 4, 4, 5, 3, 3, 3, 3,
   3, 3, 3, 3, 2, 2, 2, 3, 3, 3, 3, 3};
x = Range[1, 600];
data = Transpose[{x, y}];
Now for the fit:
(* Initial values for parameters *)
a0Init = Min[y];
a1Init = Max[y];
a2Init = x.y/Total[y];
a3Init = 2 ((x^2).y/Total[y] - a2Init^2);

(* Fit *)
nlm = NonlinearModelFit[data, a0 + a1 Exp[-(z - a2)^2/a3],
  {{a0, a0Init}, {a1, a1Init}, {a2, a2Init}, {a3, a3Init}}, z];
nlm["BestFitParameters"]
(* {a0 -> 2.697330986650647, a1 -> 58.59524798464212,
    a2 -> 288.7789879123043, a3 -> 853.7459256185134} *)

(* Display fit *)
Show[ListPlot[data, PlotRange -> All],
 Plot[nlm[z], {z, 1, 600}, PlotRange -> All, PlotStyle -> Red]]


