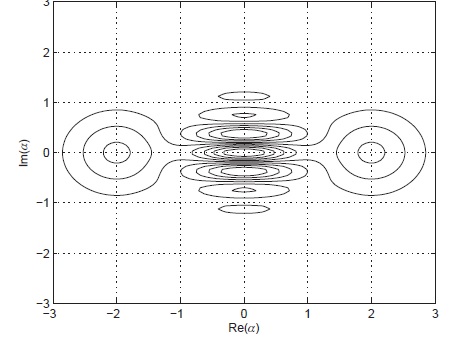
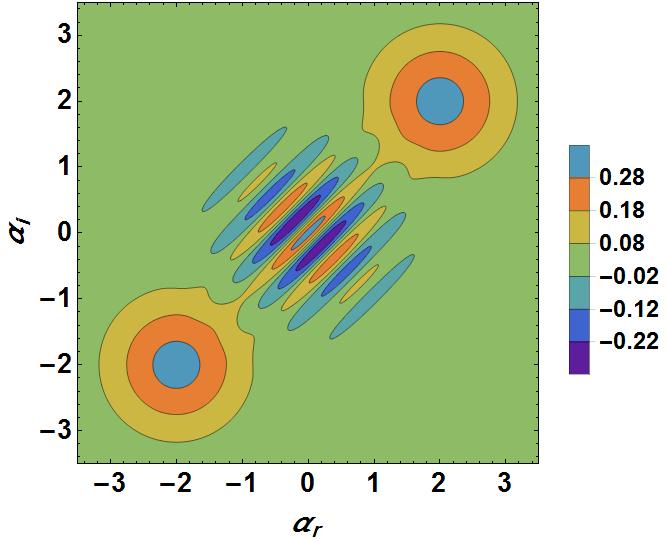
The real contour plot is taken from a textbook (Quantum Optics by Girish Agarwal, Cambridge U Press, 2013, page 80):

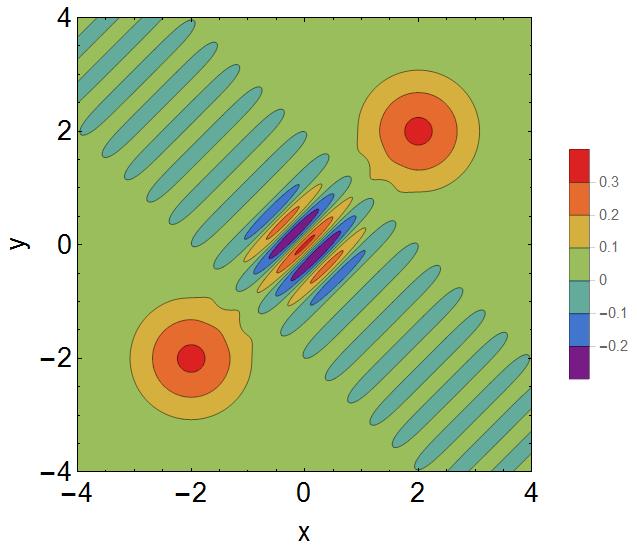
To emphasize that it is not a problem for a special case, here I have added another code and figure. You can see the "ugly" ovals are definitely incorrect.
ContourPlot[
1/((2 + 2/E^16) \[Pi])
2 (E^(((2 + 2 I) - x - I y) ((-2 + 2 I) + x - I y)) +
E^(((-2 - 2 I) - x - I y) ((2 - 2 I) + x - I y)) +
E^((-x - I y) (x - I y)) Cos[4 Im[(2 - 2 I) (x + I y)]]), {x, -4,
4}, {y, -4, 4}, PlotLegends -> Automatic,
ColorFunction -> "Rainbow", FrameLabel -> {"x", "y"}, Frame ->  True,
FrameStyle -> Directive[Black, 18], PlotPoints -> 180,
PlotRange -> All, PlotRangePadding -> 0]


