This is by no means a complete analysis of levels. (See Leonid's book for a more thorough presentation.)
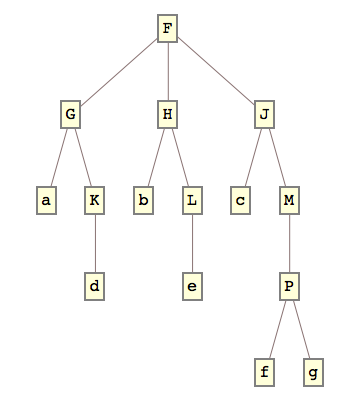
You can visualize levels with TreeForm:
x = F[G[a, K[d]], H[b, L[e]], J[c, M[P[f, g]]]];
TreeForm[x]
I avoided nested lists for clarity; also, because the output of Level is itself put into a list.

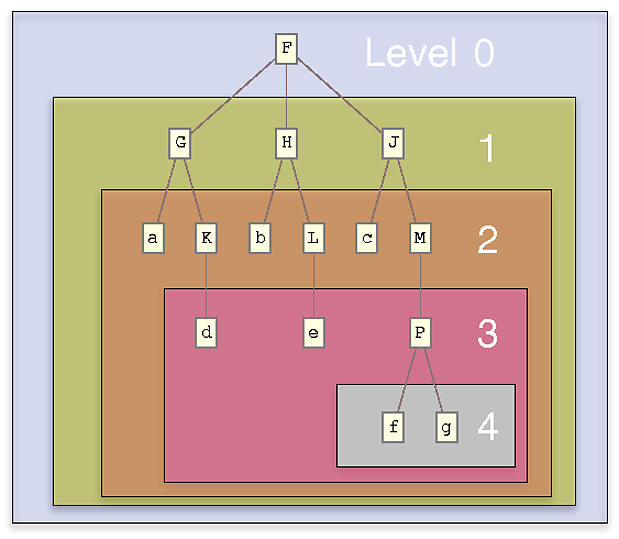
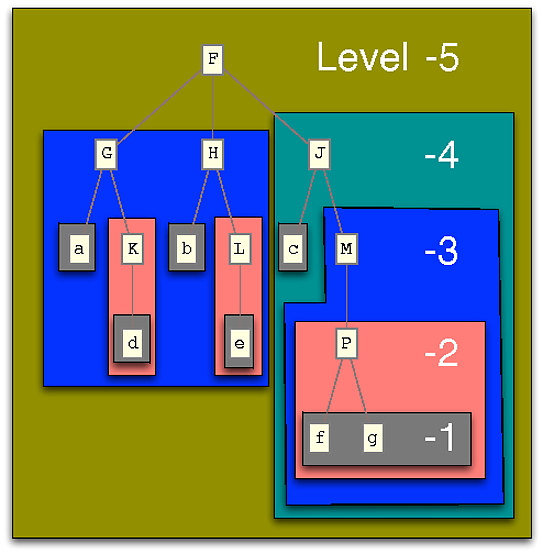
One must resist the temptation to think of levels as the vertical height of vertices on a TreeForm display. A single Level will often cut a vertical swath out of the TreeForm, as the following shows.
Positive Levels
Here's a diagram of levels corresponding to non-negative integers. When the parameter in braces is positive, the results will always begin at the same depth in the tree; however, the end depth (where a leaf terminates a branch) depends on the depth of the branch, not the (greatest) depth of the tree.
Notice that level 0 contains the head, F as well as all of the arguments inside it. Level 5 contains nothing; there is no level 5.
Grid@Table[{"level ", k, " ", Level[x, {k}], "\n"}, {k, 0, 5}]


Negative Levels
Here counting begins from the bottom of the tree. The "bottom" lies at various depths, as the following example shows. Level -1 holds the leaves of the tree.
Grid@Table[{"level ", k, " ", Level[x, {-k}], "\n"}, {k, 1, 5}]


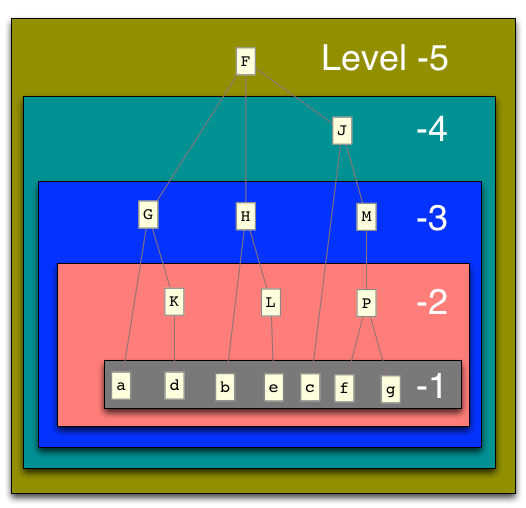
Raul Nahrain suggested drawing the tree itself "from the bottom of the pane to the top".
Mathematica will not display TreeForm this way; you'll need to hand edit it.
But what you get is clearer, provided that you realize that we are using a non-standard display of TreeForm.


