added 67 characters in body
Source Link
lio
  • 2.4k
  • 14
  • 26

I cannot find a list of standard plot markers (square, trinagle, dot, circle, disk, cross, plus, ...) and how to use them.

Fore example I can access a self made cross, by:

cross = Graphics[{Blue, Line[{{{-1, -1}, {1, 1}}, {{-1, 1}, {1, -1}}}]}]; 

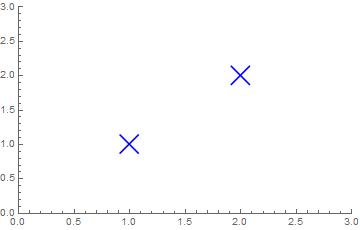
ListPlot[{{1, 1}, {2, 2}}, PlotMarkers -> {cross, 0.1}, PlotRange -> {{0, 32.5}, {0, 32.5}}], 
 AspectRatio -> Automatic]

enter image description hereenter image description here

Is this symbol and the others in the list predefined, and how can I use them in a plot?

UPDATE:

Following Carl Wolls proposal I tried:

p = Style[Graphics`PlotMarkers[][[6, 1]], FontFamily -> "Times"];

circle = Graphics[Circle[{0, 0}, 1]];

range = Range[0.9, 1.15, 0.1];

ListPlot[{{{1, 1}, {2, 2}}, {{1, 1}, {2, 2}}, {{1, 1}, {2, 2}}}, 
 PlotMarkers -> {{p, 300}, {cross, 0.05}, {circle, 0.53}}, 
 GridLines -> {range, range}, 
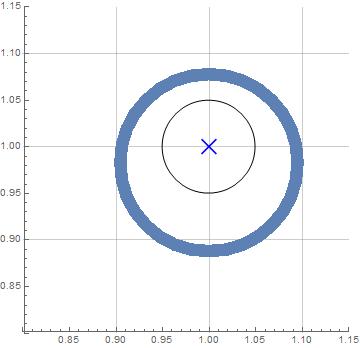
 PlotRange -> {{0.858, 1.15}, {0.758, 1.215}}], AspectRatio -> Automatic]

enter image description hereenter image description here

As you see the symbol p is still not centered around the data point {1,1}, whereas circle and cross are correct.

I cannot find a list of standard plot markers (square, trinagle, dot, circle, disk, cross, plus, ...) and how to use them.

Fore example I can access a self made cross, by:

cross = Graphics[{Blue, Line[{{{-1, -1}, {1, 1}}, {{-1, 1}, {1, -1}}}]}];
ListPlot[{{1, 1}, {2, 2}}, PlotMarkers -> {cross, 0.1}, PlotRange -> {{0, 3}, {0, 3}}]

enter image description here

Is this symbol and the others in the list predefined, and how can I use them in a plot?

UPDATE:

Following Carl Wolls proposal I tried:

p = Style[Graphics`PlotMarkers[][[6, 1]], FontFamily -> "Times"];

circle = Graphics[Circle[{0, 0}, 1]];

range = Range[0.9, 1.15, 0.1];

ListPlot[{{{1, 1}, {2, 2}}, {{1, 1}, {2, 2}}, {{1, 1}, {2, 2}}}, 
 PlotMarkers -> {{p, 300}, {cross, 0.05}, {circle, 0.5}}, 
 GridLines -> {range, range}, 
 PlotRange -> {{0.85, 1.15}, {0.75, 1.2}}]

enter image description here

As you see the symbol p is still not centered around the data point {1,1}, whereas circle and cross are correct.
I cannot find a list of standard plot markers (square, trinagle, dot, circle, disk, cross, plus, ...) and how to use them.

Fore example I can access a self made cross, by:

cross = Graphics[{Blue, Line[{{{-1, -1}, {1, 1}}, {{-1, 1}, {1, -1}}}]}]; 

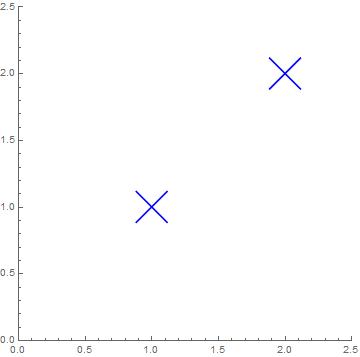
ListPlot[{{1, 1}, {2, 2}}, PlotMarkers -> {cross, 0.1}, PlotRange -> {{0, 2.5}, {0, 2.5}}, 
 AspectRatio -> Automatic]

enter image description here

Is this symbol and the others in the list predefined, and how can I use them in a plot?

UPDATE:

Following Carl Wolls proposal I tried:

p = Style[Graphics`PlotMarkers[][[6, 1]], FontFamily -> "Times"];

circle = Graphics[Circle[{0, 0}, 1]];

range = Range[0.9, 1.15, 0.1];

ListPlot[{{{1, 1}, {2, 2}}, {{1, 1}, {2, 2}}, {{1, 1}, {2, 2}}}, 
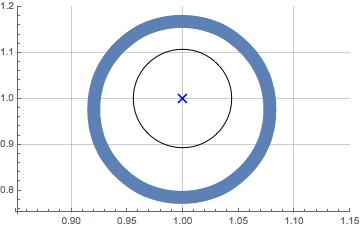
 PlotMarkers -> {{p, 300}, {cross, 0.05}, {circle, 0.3}}, GridLines -> {range, range}, 
 PlotRange -> {{0.8, 1.15}, {0.8, 1.15}}, AspectRatio -> Automatic]

enter image description here

As you see the symbol p is still not centered around the data point {1,1}, whereas circle and cross are correct.
Tweeted twitter.com/StackMma/status/900699591204536321
added 656 characters in body
Source Link
lio
  • 2.4k
  • 14
  • 26

I cannot find a list of standard plot markers (square, trinagle, dot, circle, disk, cross, plus, ...) and how to use them.

Fore example I can access a self made cross, by:

cross = Graphics[{Blue, Line[{{{-1, -1}, {1, 1}}, {{-1, 1}, {1, -1}}}]}];
ListPlot[{{1, 1}, {2, 2}}, PlotMarkers -> {cross, 0.1}, PlotRange -> {{0, 3}, {0, 3}}]

enter image description here

Is this symbol and the others in the list predefined, and how can I use them in a plot?

UPDATE:

Following Carl Wolls proposal I tried:

p = Style[Graphics`PlotMarkers[][[6, 1]], FontFamily -> "Times"];

circle = Graphics[Circle[{0, 0}, 1]];

range = Range[0.9, 1.15, 0.1];

ListPlot[{{{1, 1}, {2, 2}}, {{1, 1}, {2, 2}}, {{1, 1}, {2, 2}}}, 
 PlotMarkers -> {{p, 300}, {cross, 0.05}, {circle, 0.5}}, 
 GridLines -> {range, range}, 
 PlotRange -> {{0.85, 1.15}, {0.75, 1.2}}]

enter image description here

As you see the symbol p is still not centered around the data point {1,1}, whereas circle and cross are correct.
I cannot find a list of standard plot markers (square, trinagle, dot, circle, disk, cross, plus, ...) and how to use them.

Fore example I can access a self made cross, by:

cross = Graphics[{Blue, Line[{{{-1, -1}, {1, 1}}, {{-1, 1}, {1, -1}}}]}];
ListPlot[{{1, 1}, {2, 2}}, PlotMarkers -> {cross, 0.1}, PlotRange -> {{0, 3}, {0, 3}}]

enter image description here

Is this symbol and the others in the list predefined, and how can I use them in a plot?

UPDATE:

Following Carl Wolls proposal I tried:

p = Style[Graphics`PlotMarkers[][[6, 1]], FontFamily -> "Times"];

circle = Graphics[Circle[{0, 0}, 1]];

range = Range[0.9, 1.15, 0.1];

ListPlot[{{{1, 1}, {2, 2}}, {{1, 1}, {2, 2}}, {{1, 1}, {2, 2}}}, 
 PlotMarkers -> {{p, 300}, {cross, 0.05}, {circle, 0.5}}, 
 GridLines -> {range, range}, 
 PlotRange -> {{0.85, 1.15}, {0.75, 1.2}}]

enter image description here

As you see the symbol p is still not centered around the data point {1,1}, whereas circle and cross are correct.

Source Link
lio
  • 2.4k
  • 14
  • 26

How to use standard plot markers

I cannot find a list of standard plot markers (square, trinagle, dot, circle, disk, cross, plus, ...) and how to use them.

Fore example I can access a self made cross, by:

cross = Graphics[{Blue, Line[{{{-1, -1}, {1, 1}}, {{-1, 1}, {1, -1}}}]}];
ListPlot[{{1, 1}, {2, 2}}, PlotMarkers -> {cross, 0.1}, PlotRange -> {{0, 3}, {0, 3}}]

enter image description here

Is this symbol and the others in the list predefined, and how can I use them in a plot?