Bumped by Community user
deleted 45 characters in body
Source Link
Andrea G
  • 769
  • 3
  • 19

I have a function f(x) which I would like to see going up for very low values of x: from an asymptotic study, I expect it to go to Infinity for low x; however, I can see an elbow and many oscillations. Are they due to numerical precision? How can I fix it? The function f(x) of interest is fon(beta).

 firstk = -8;
 lastk = 0;
 fon = 0.05379*beta/IntegralExact;
 IntegrandON = 
 Simplify[Abs[
  1 - (1 - I)/2*Sqrt[(beta/2)]*
    Cosh[(1 - I)*z*
       Sqrt[(beta/2)]]/(Sinh[(1 - I)/2*Sqrt[(beta/2)]])] // 
 ComplexExpand, beta > 0]^2;
 IntegralExact = FullSimplify[Integrate[IntegrandON, {z, -1/2, 1/2}]];

 Show[Flatten[{LogLogPlot[{fon}, {beta, 10^firstk, 10^lastk}, 
PlotLegends -> {"On-axis"}, PlotStyle -> Black, 
PlotRange -> {{10^firstk, 10^lastk}, {10^-6, 10^(8)}}, 
GridLines -> {{46}, All}]}], ImageSize -> Large,  
FrameLabel -> {"\[Beta]", "\.08F(\[Beta])"}, Frame -> True]

enter image description here

I have a function f(x) which I would like to see going up for very low values of x: from an asymptotic study, I expect it to go to Infinity for low x; however, I can see an elbow and many oscillations. Are they due to numerical precision? How can I fix it? The function f(x) of interest is fon(beta).

 firstk = -8;
 lastk = 0;
 fon = 0.05379*beta/IntegralExact;
 IntegrandON = 
 Simplify[Abs[
  1 - (1 - I)/2*Sqrt[(beta/2)]*
    Cosh[(1 - I)*z*
       Sqrt[(beta/2)]]/(Sinh[(1 - I)/2*Sqrt[(beta/2)]])] // 
 ComplexExpand, beta > 0]^2;
 IntegralExact = FullSimplify[Integrate[IntegrandON, {z, -1/2, 1/2}]];

 Show[Flatten[{LogLogPlot[{fon}, {beta, 10^firstk, 10^lastk}, 
PlotLegends -> {"On-axis"}, PlotStyle -> Black, 
PlotRange -> {{10^firstk, 10^lastk}, {10^-6, 10^(8)}}, 
GridLines -> {{46}, All}]}], ImageSize -> Large,  
FrameLabel -> {"\[Beta]", "\.08F(\[Beta])"}, Frame -> True]
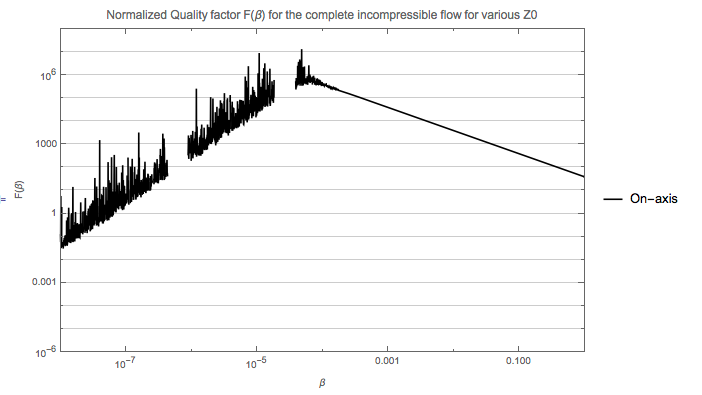
enter image description here

I have a function f(x) which I would like to see going up for very low values of x: from an asymptotic study, I expect it to go to Infinity for low x; however, I can see an elbow and many oscillations. Are they due to numerical precision? How can I fix it? The function f(x) of interest is fon(beta).

 firstk = -8;
 lastk = 0;
 fon = 0.05379*beta/IntegralExact;
 IntegrandON = 
 Simplify[Abs[
  1 - (1 - I)/2*Sqrt[(beta/2)]*
    Cosh[(1 - I)*z*
       Sqrt[(beta/2)]]/(Sinh[(1 - I)/2*Sqrt[(beta/2)]])] // 
 ComplexExpand, beta > 0]^2;
 IntegralExact = FullSimplify[Integrate[IntegrandON, {z, -1/2, 1/2}]];

 Show[Flatten[{LogLogPlot[{fon}, {beta, 10^firstk, 10^lastk}, 
PlotLegends -> {"On-axis"}, PlotStyle -> Black, 
PlotRange -> {{10^firstk, 10^lastk}, {10^-6, 10^(8)}}, 
GridLines -> {{46}, All}]}], ImageSize -> Large,  
Frame -> True]

enter image description here

Source Link
Andrea G
  • 769
  • 3
  • 19

How to use Working Precision to get good result and plot?

I have a function f(x) which I would like to see going up for very low values of x: from an asymptotic study, I expect it to go to Infinity for low x; however, I can see an elbow and many oscillations. Are they due to numerical precision? How can I fix it? The function f(x) of interest is fon(beta).

 firstk = -8;
 lastk = 0;
 fon = 0.05379*beta/IntegralExact;
 IntegrandON = 
 Simplify[Abs[
  1 - (1 - I)/2*Sqrt[(beta/2)]*
    Cosh[(1 - I)*z*
       Sqrt[(beta/2)]]/(Sinh[(1 - I)/2*Sqrt[(beta/2)]])] // 
 ComplexExpand, beta > 0]^2;
 IntegralExact = FullSimplify[Integrate[IntegrandON, {z, -1/2, 1/2}]];

 Show[Flatten[{LogLogPlot[{fon}, {beta, 10^firstk, 10^lastk}, 
PlotLegends -> {"On-axis"}, PlotStyle -> Black, 
PlotRange -> {{10^firstk, 10^lastk}, {10^-6, 10^(8)}}, 
GridLines -> {{46}, All}]}], ImageSize -> Large,  
FrameLabel -> {"\[Beta]", "\.08F(\[Beta])"}, Frame -> True]

enter image description here