Update
Show zero values and some other improvements
 data =
   {{{20120802}, 193.9}, {{20120912}, 493.9}, {{20130412}, 33.9},
    {{20130502}, 193.9}, {{20130802}, 193.9}, {{20130822}, 193.9},
    {{20131002}, 193.9}, {{20131022}, 193.9}};
Convert dates
dat = MapAt[DateList@*ToString@*First, data, {All, 1}]
{{{2012, 8, 2, 0, 0, 0.}, 193.9}, {{2012, 9, 12, 0, 0, 0.}, 493.9}...}
All months with default value zero - must start with year or quarter
amo = Transpose[{#, Array[0 &, {Length@#}]}] &[DateRange[{2012}, {2014}, "Month"]]
{{{2012, 1, 1}, 0}, {{2012, 2, 1}, 0} ... {{2014, 1, 1}, 0}}
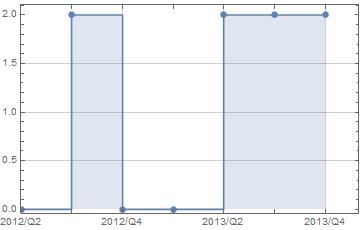
DateListPlot[
 TimeSeriesAggregate[Join[dat, amo], {"Quarter", Left}, Count[#, _?Positive] &],
 DateTicksFormat -> {"Year", "/", "QuarterNameShort"},
 Filling -> Bottom,
 GridLines -> Automatic,
 InterpolationOrder -> 0,
 PlotRange -> {{{2012, 4, 1}, {2013, 12, 1}}, Automatic},
 Mesh -> Full]
Original answer
To get an accurate aggregation we must start at {20120101}:


