added 10 characters in body
Source Link
Sascha
  • 8.5k
  • 2
  • 34
  • 66

As indicated by your comment you are not strictly looking for the line that has the minimum total distance with all points. If you just like to find a line that separates your data well you could use a SVM. Since I haven't played to much with Classify to be able and tell how easy it is to get the parameters out, I though of another similar approach. I will show how to solve this with the simplest neural net possible: a single perceptron.

The perceptron is simply:

p = NetChain[{1, LogisticSigmoid}, "Input" -> 2, "Output" -> NetDecoder["Scalar"]]

To generate the training data we assign the the label 0 to the first and the label 1 to the second cluster.

trainingData = cluster // MapIndexed[Thread[Rule[#1, First@#2 - 1]] &] // Flatten

Now we can train our perceptron with

trained = NetTrain[perceptron, trainingData ]

and extract the weights and bias term with

{{{w1, w2}}, {bias}} = NetExtract[trained, {{ 1, "Weights"}, {1, "Biases"}}]

The line defined by $w_1 * x + w_2 *y + bias$$w_1 \cdot x + w_2 \cdot y + bias$ can be plotted together with the original points via

Show[ListPlot[cluster], Plot[y /. Solve[w1 x + w2 y + bias == 0, y], {x, 0, 1}]]

image

As indicated by your comment you are not strictly looking for the line that has the minimum total distance with all points. If you just like to find a line that separates your data well you could use a SVM. Since I haven't played to much with Classify to be able and tell how easy it is to get the parameters out, I though of another similar approach. I will show how to solve this with the simplest neural net possible: a single perceptron.

The perceptron is simply:

p = NetChain[{1, LogisticSigmoid}, "Input" -> 2, "Output" -> NetDecoder["Scalar"]]

To generate the training data we assign the the label 0 to the first and the label 1 to the second cluster.

trainingData = cluster // MapIndexed[Thread[Rule[#1, First@#2 - 1]] &] // Flatten

Now we can train our perceptron with

trained = NetTrain[perceptron, trainingData ]

and extract the weights and bias term with

{{{w1, w2}}, {bias}} = NetExtract[trained, {{ 1, "Weights"}, {1, "Biases"}}]

The line defined by $w_1 * x + w_2 *y + bias$ can be plotted together with the original points via

Show[ListPlot[cluster], Plot[y /. Solve[w1 x + w2 y + bias == 0, y], {x, 0, 1}]]
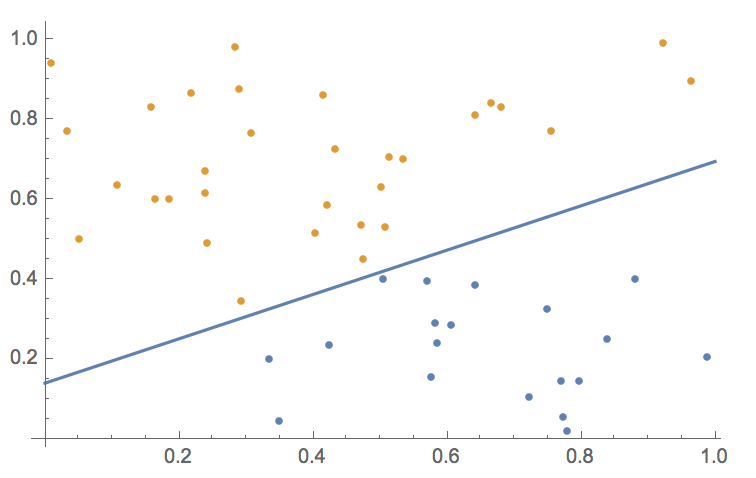
image

As indicated by your comment you are not strictly looking for the line that has the minimum total distance with all points. If you just like to find a line that separates your data well you could use a SVM. Since I haven't played to much with Classify to be able and tell how easy it is to get the parameters out, I though of another similar approach. I will show how to solve this with the simplest neural net possible: a single perceptron.

The perceptron is simply:

p = NetChain[{1, LogisticSigmoid}, "Input" -> 2, "Output" -> NetDecoder["Scalar"]]

To generate the training data we assign the the label 0 to the first and the label 1 to the second cluster.

trainingData = cluster // MapIndexed[Thread[Rule[#1, First@#2 - 1]] &] // Flatten

Now we can train our perceptron with

trained = NetTrain[perceptron, trainingData ]

and extract the weights and bias term with

{{{w1, w2}}, {bias}} = NetExtract[trained, {{ 1, "Weights"}, {1, "Biases"}}]

The line defined by $w_1 \cdot x + w_2 \cdot y + bias$ can be plotted together with the original points via

Show[ListPlot[cluster], Plot[y /. Solve[w1 x + w2 y + bias == 0, y], {x, 0, 1}]]

image

Source Link
Sascha
  • 8.5k
  • 2
  • 34
  • 66

As indicated by your comment you are not strictly looking for the line that has the minimum total distance with all points. If you just like to find a line that separates your data well you could use a SVM. Since I haven't played to much with Classify to be able and tell how easy it is to get the parameters out, I though of another similar approach. I will show how to solve this with the simplest neural net possible: a single perceptron.

The perceptron is simply:

p = NetChain[{1, LogisticSigmoid}, "Input" -> 2, "Output" -> NetDecoder["Scalar"]]

To generate the training data we assign the the label 0 to the first and the label 1 to the second cluster.

trainingData = cluster // MapIndexed[Thread[Rule[#1, First@#2 - 1]] &] // Flatten

Now we can train our perceptron with

trained = NetTrain[perceptron, trainingData ]

and extract the weights and bias term with

{{{w1, w2}}, {bias}} = NetExtract[trained, {{ 1, "Weights"}, {1, "Biases"}}]

The line defined by $w_1 * x + w_2 *y + bias$ can be plotted together with the original points via

Show[ListPlot[cluster], Plot[y /. Solve[w1 x + w2 y + bias == 0, y], {x, 0, 1}]]

image