deleted 8 characters in body
Source Link
Mr.Wizard
  • 273.1k
  • 34
  • 595
  • 1.4k
data1 = RandomVariate[NormalDistribution[], 1000];
data2 = RandomVariate[NormalDistribution[], 1000];
GraphicsRow[{
  Rotate[Graphics[SmoothHistogram[data1, 
     PlotStyle -> Red, 
     Filling -> Axis,
     PlotRange -> {{-3.5, 3.5}, Automatic}]], \[Pi]π/2],
  Rotate[Graphics[SmoothHistogram[data2, PlotStyle -> Green,
     Filling -> Axis, PlotRange -> {{-3.5, 3.5}, Automatic}]], -\[Pi]π/
    2]},
 Spacings -> {-234, 5}
 ]

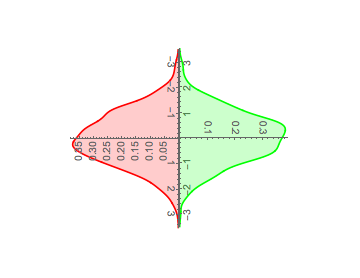
enter image description here

(You may need to flip one distribution to keep the orientation of the vertical axes the same for the two plots.)

data1 = RandomVariate[NormalDistribution[], 1000];
data2 = RandomVariate[NormalDistribution[], 1000];
GraphicsRow[{
  Rotate[Graphics[SmoothHistogram[data1, 
     PlotStyle -> Red, 
     Filling -> Axis,
     PlotRange -> {{-3.5, 3.5}, Automatic}]], \[Pi]/2],
  Rotate[Graphics[SmoothHistogram[data2, PlotStyle -> Green,
     Filling -> Axis, PlotRange -> {{-3.5, 3.5}, Automatic}]], -\[Pi]/
    2]},
 Spacings -> {-234, 5}
 ]

enter image description here

(You may need to flip one distribution to keep the orientation of the vertical axes the same for the two plots.)

data1 = RandomVariate[NormalDistribution[], 1000];
data2 = RandomVariate[NormalDistribution[], 1000];
GraphicsRow[{
  Rotate[Graphics[SmoothHistogram[data1, 
     PlotStyle -> Red, 
     Filling -> Axis,
     PlotRange -> {{-3.5, 3.5}, Automatic}]], π/2],
  Rotate[Graphics[SmoothHistogram[data2, PlotStyle -> Green,
     Filling -> Axis, PlotRange -> {{-3.5, 3.5}, Automatic}]], -π/
    2]},
 Spacings -> {-234, 5}
 ]

enter image description here

(You may need to flip one distribution to keep the orientation of the vertical axes the same for the two plots.)

added 91 characters in body
Source Link
David G. Stork
  • 42.3k
  • 3
  • 37
  • 106
data1 = RandomVariate[NormalDistribution[], 1000];
data2 = RandomVariate[NormalDistribution[], 1000];
GraphicsRow[{
  Rotate[Graphics[SmoothHistogram[data1, 
     PlotStyle -> Red, 
     Filling -> Axis,
     PlotRange -> {{-3.5, 3.5}, Automatic}]], \[Pi]/2],
  Rotate[Graphics[SmoothHistogram[data2, PlotStyle -> Green,
     Filling -> Axis, PlotRange -> {{-3.5, 3.5}, Automatic}]], -\[Pi]/
    2]},
 Spacings -> {-234, 5}
 ]

enter image description here

(You may need to flip one distribution to keep the orientation of the vertical axes the same for the two plots.)

data1 = RandomVariate[NormalDistribution[], 1000];
data2 = RandomVariate[NormalDistribution[], 1000];
GraphicsRow[{
  Rotate[Graphics[SmoothHistogram[data1, 
     PlotStyle -> Red, 
     Filling -> Axis,
     PlotRange -> {{-3.5, 3.5}, Automatic}]], \[Pi]/2],
  Rotate[Graphics[SmoothHistogram[data2, PlotStyle -> Green,
     Filling -> Axis, PlotRange -> {{-3.5, 3.5}, Automatic}]], -\[Pi]/
    2]},
 Spacings -> {-234, 5}
 ]

enter image description here

(You may need to flip one distribution to keep the orientation of the vertical axes the same for the two plots.)

added 130 characters in body
Source Link
David G. Stork
  • 42.3k
  • 3
  • 37
  • 106
data1 = RandomVariate[NormalDistribution[], 1000];
data2 = RandomVariate[NormalDistribution[], 1000];
GraphicsRow[{
  1000]; PairedHistogram[data1Rotate[Graphics[SmoothHistogram[data1, data2
     PlotStyle -> Red, BarSpacing
     Filling -> NoneAxis,
 ChartStyle    PlotRange -> {{Blue-3.5, 3.5}, Automatic}]], \[Pi]/2],
  Rotate[Graphics[SmoothHistogram[data2, PlotStyle -> Green,
     Filling -> Axis, PlotRange -> {{-3.5, 3.5}, NoneAutomatic}]], -\[Pi]/
    2]},
 Spacings -> {-234, 5}
 ]
data1 = RandomVariate[NormalDistribution[], 1000];
data2 = RandomVariate[NormalDistribution[], 
  1000]; PairedHistogram[data1, data2, BarSpacing -> None,
 ChartStyle -> {{Blue, Green}, None}]
data1 = RandomVariate[NormalDistribution[], 1000];
data2 = RandomVariate[NormalDistribution[], 1000];
GraphicsRow[{
  Rotate[Graphics[SmoothHistogram[data1, 
     PlotStyle -> Red, 
     Filling -> Axis,
     PlotRange -> {{-3.5, 3.5}, Automatic}]], \[Pi]/2],
  Rotate[Graphics[SmoothHistogram[data2, PlotStyle -> Green,
     Filling -> Axis, PlotRange -> {{-3.5, 3.5}, Automatic}]], -\[Pi]/
    2]},
 Spacings -> {-234, 5}
 ]
Source Link
David G. Stork
  • 42.3k
  • 3
  • 37
  • 106
Loading