edited tags
Link
user21
  • 40.7k
  • 8
  • 114
  • 170
Tweeted twitter.com/StackMma/status/1523045011675246593
edited tags
Link
user21
  • 40.7k
  • 8
  • 114
  • 170
added 8 characters in body
Source Link

I have a solution of Laplace's equation which shows electric potential. I would like to get some data on electric field strength, that is to say a negative gradient of the potential. Here is the code:

ClearAll["Global`*"]
Needs["NDSolve`FEM`"]

circle = Disk[{4.5, 3}, 0.5];
pin = Rectangle[{4, 0}, {5, 3}];
square = Rectangle[{0, 0}, {9, 9}];
region = RegionDifference[square, RegionUnion[circle, pin]];

regionplot = RegionPlot[region, PlotTheme -> "Monochrome"];

mesh = ToElementMesh[DiscretizeRegion[region], MaxCellMeasure -> 0.0025
   ];

bc = {DirichletCondition[u[x, y] == 0, y == 9],
   
   DirichletCondition[u[x, y] == 10, (4.2 <= x <= 4.8) && y <= 4]};

sol = NDSolveValue[{D[u[x, y], x, x] + D[u[x, y], y, y] == 0 , bc}, 
   u, {x, y} \[Element] mesh];

DensityPlot[sol[x, y], {x, y} \[Element] mesh, Mesh -> All, 
 ColorFunction -> "Rainbow", PlotRange -> All, 
 PlotLegends -> Automatic]

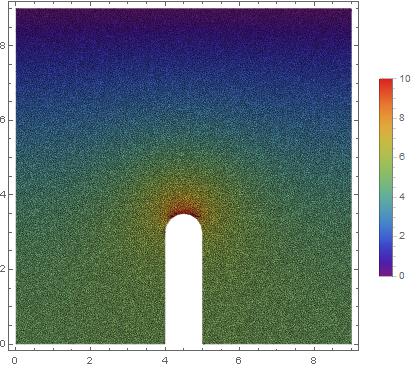
DensityPlot looks like this:

densityplot

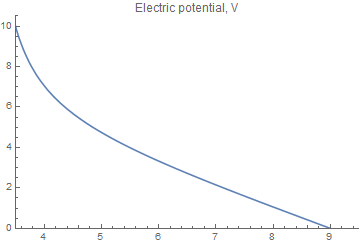
Now I am looking at the very top of the semicircular area where u[x,y]==10. I want a plot of the potential along the center line (x==4.5 and 3.5 =< y <= 9), so I do this:

Plot[sol[4.5, x], {x, 3.5, 9}, PlotRange -> {{3.5, 9.5}, {0, 10.5}} , 
 AxesOrigin -> {3.5, 0}, PlotLabel -> "Electric potential, V"]

The result is this:

potential

Now I would like to see what the negative gradient of u[x,y] is like for the same x==4.5 and 3.5 =< y <= 9. For that I do:

electricField = -Grad[sol[x, y], {x, y}];
VectorPlot[electricField, {x, y} \[Element] mesh, 
 PlotRange -> {{3, 6}, {2.5, 5}}, VectorPoints -> 50]

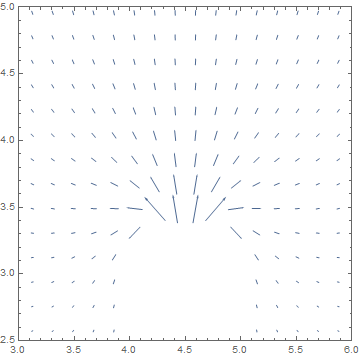
Setting PlotRange to zoom in to the top of the semicircle gives this plot:

vectorfield

And finally I ran into a problem. I would like to plot a magnitude of the electric field along the center line (x==4.5 and 3.5 =< y <= 9) just like I did with the electric potential. How do I do this? I suppose I can either extract it from -Grad[sol[x, y], {x, y}] or from the plot of electric potential.

This question is related to this post. I used Mathematica 10.3.

I have a solution of Laplace's equation which shows electric potential. I would like to get some data on electric field strength, that is to say a negative gradient of the potential. Here is the code:

ClearAll["Global`*"]
Needs["NDSolve`FEM`"]

circle = Disk[{4.5, 3}, 0.5];
pin = Rectangle[{4, 0}, {5, 3}];
square = Rectangle[{0, 0}, {9, 9}];
region = RegionDifference[square, RegionUnion[circle, pin]];

regionplot = RegionPlot[region, PlotTheme -> "Monochrome"];

mesh = ToElementMesh[DiscretizeRegion[region], MaxCellMeasure -> 0.0025
   ];

bc = {DirichletCondition[u[x, y] == 0, y == 9],
   
   DirichletCondition[u[x, y] == 10, (4.2 <= x <= 4.8) && y <= 4]};

sol = NDSolveValue[{D[u[x, y], x, x] + D[u[x, y], y, y] == 0 , bc}, 
   u, {x, y} \[Element] mesh];

DensityPlot[sol[x, y], {x, y} \[Element] mesh, Mesh -> All, 
 ColorFunction -> "Rainbow", PlotRange -> All, 
 PlotLegends -> Automatic]

DensityPlot looks like this:

densityplot

Now I am looking at the very top of the semicircular area where u[x,y]==10. I want a plot of the potential along the center line (x==4.5 and 3.5 =< y <= 9), so I do this:

Plot[sol[4.5, x], {x, 3.5, 9}, PlotRange -> {{3.5, 9.5}, {0, 10.5}} , 
 AxesOrigin -> {3.5, 0}, PlotLabel -> "Electric potential, V"]

The result is this:

potential

Now I would like to see what the negative gradient of u[x,y] for the same x==4.5 and 3.5 =< y <= 9. For that I do:

electricField = -Grad[sol[x, y], {x, y}];
VectorPlot[electricField, {x, y} \[Element] mesh, 
 PlotRange -> {{3, 6}, {2.5, 5}}, VectorPoints -> 50]

Setting PlotRange to zoom in to the top of the semicircle gives this plot:

vectorfield

And finally I ran into a problem. I would like to plot a magnitude of the electric field along the center line (x==4.5 and 3.5 =< y <= 9) just like I did with the electric potential. How do I do this? I suppose I can either extract it from -Grad[sol[x, y], {x, y}] or from the plot of electric potential.

This question is related to this post. I used Mathematica 10.3.
I have a solution of Laplace's equation which shows electric potential. I would like to get some data on electric field strength, that is to say a negative gradient of the potential. Here is the code:

ClearAll["Global`*"]
Needs["NDSolve`FEM`"]

circle = Disk[{4.5, 3}, 0.5];
pin = Rectangle[{4, 0}, {5, 3}];
square = Rectangle[{0, 0}, {9, 9}];
region = RegionDifference[square, RegionUnion[circle, pin]];

regionplot = RegionPlot[region, PlotTheme -> "Monochrome"];

mesh = ToElementMesh[DiscretizeRegion[region], MaxCellMeasure -> 0.0025
   ];

bc = {DirichletCondition[u[x, y] == 0, y == 9],
   
   DirichletCondition[u[x, y] == 10, (4.2 <= x <= 4.8) && y <= 4]};

sol = NDSolveValue[{D[u[x, y], x, x] + D[u[x, y], y, y] == 0 , bc}, 
   u, {x, y} \[Element] mesh];

DensityPlot[sol[x, y], {x, y} \[Element] mesh, Mesh -> All, 
 ColorFunction -> "Rainbow", PlotRange -> All, 
 PlotLegends -> Automatic]

DensityPlot looks like this:

densityplot

Now I am looking at the very top of the semicircular area where u[x,y]==10. I want a plot of the potential along the center line (x==4.5 and 3.5 =< y <= 9), so I do this:

Plot[sol[4.5, x], {x, 3.5, 9}, PlotRange -> {{3.5, 9.5}, {0, 10.5}} , 
 AxesOrigin -> {3.5, 0}, PlotLabel -> "Electric potential, V"]

The result is this:

potential

Now I would like to see what the negative gradient of u[x,y] is like for the same x==4.5 and 3.5 =< y <= 9. For that I do:

electricField = -Grad[sol[x, y], {x, y}];
VectorPlot[electricField, {x, y} \[Element] mesh, 
 PlotRange -> {{3, 6}, {2.5, 5}}, VectorPoints -> 50]

Setting PlotRange to zoom in to the top of the semicircle gives this plot:

vectorfield

And finally I ran into a problem. I would like to plot a magnitude of the electric field along the center line (x==4.5 and 3.5 =< y <= 9) just like I did with the electric potential. How do I do this? I suppose I can either extract it from -Grad[sol[x, y], {x, y}] or from the plot of electric potential.

This question is related to this post. I used Mathematica 10.3.
Source Link
Loading