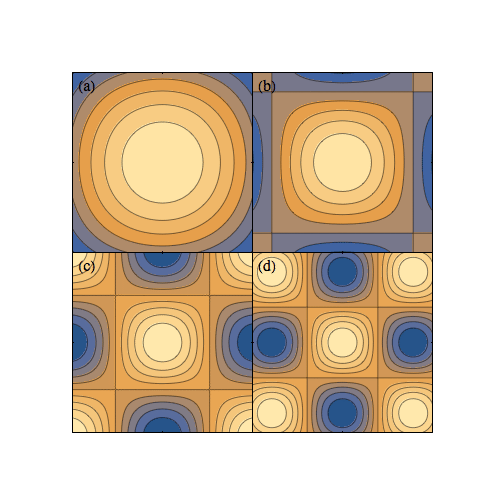
I'm using SciDraw to make an array of ContourPlots, but my attempt to use XTicks and YTicks isn't working. Why?
Note that I need to keep the creation of plots separate from the rest of the code (because in my use case I'm receiving the plots from someone else).
plots = Table[
   ContourPlot[Cos[n x] Cos[n y], {x, -1, 1}, {y, -1, 1}], {n, 1, 4}];

dims = {2, 2};

(*init SciDraw first!*)

DefineStyle["SOSArray", {
  FigurePanel -> {
    XTicks -> {-1, 0, 1}, YTicks -> {-1, 0, 1},
    XPlotRange -> {-1, 1}, YPlotRange -> {-1, 1}
    }
  }]

Figure[
 Multipanel[{
   FigurePanel[{FigGraphics[plots[[1]]]}, {1, 1}];
   FigurePanel[{FigGraphics[plots[[2]]]}, {1, 2}];
   FigurePanel[{FigGraphics[plots[[3]]]}, {2, 1}];
   FigurePanel[{FigGraphics[plots[[4]]]}, {2, 2}];
   },
  Dimensions -> dims]
 , Style -> "SOSArray", CanvasSize -> {1, dims[[1]]/dims[[2]]}*5]

