added 64 characters in body
Source Link
Mr.Wizard
  • 273.1k
  • 34
  • 595
  • 1.4k

Let's start with a parametrized surface. Any one will do, but I guess being orientable helps in this case. Then calculate the unit normal, and then create a ManipulateManipulate object that lets you see how the normal behaves:

σ[u_, v_] := {(2 + Cos[v]) Cos[u], (2 + Cos[v]) Sin[u], Sin[v]}
n[u_, v_] := Evaluate[Normalize[
   Cross[D[σ[u, v], u], D[σ[u, v], v]]
   ]]
surfacePlot = 
  ParametricPlot3D[σ[u, v], {u, -Pi, Pi}, {v, -Pi, Pi},
   PlotRangePadding -> 1];
normalPlot = 
  ParametricPlot3D[n[u, v], {u, -Pi, Pi}, {v, -Pi, Pi}, 
   PlotStyle -> Opacity[0.5]];

Manipulate[
 {Show[{
    surfacePlot,
    Graphics3D[{Thick, Red, 
      Arrow[{σ @@ pt, σ @@ pt + n @@ pt}]}]
    }],
  Show[{
    normalPlot,
    Graphics3D[{Thick, Red, Arrow[{{0, 0, 0}, n @@ pt}]}]
    }]
  }
 ,
 {pt, {-Pi, -Pi}, {Pi, Pi}}]
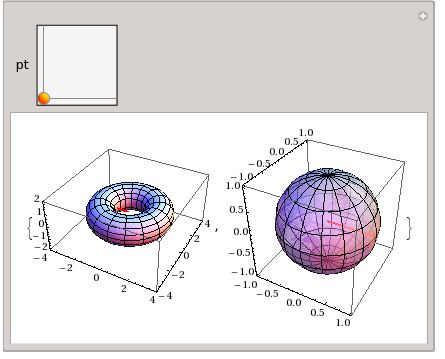
surface and normal

To show the entire vector field for a surface on parametric form you can use a bunch of Arrow's:

Show[{
  surfacePlot,
  Graphics3D[
   Table[
    Arrow[{σ[u, v], σ[u, v] + n[u, v]}],
    {u, -Pi, Pi, 0.4}, {v, -Pi, Pi, 0.4}]
   ]
  }]
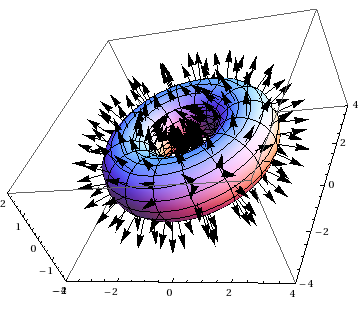
vector field

As you can see, the arrows are equally spaced in the parameter space, which leads to uneven distribution of arrows on the surface; it might be worth transforming the parametrization into $f(x,y,z)=0$ form to get a nicer result.

Let's start with a parametrized surface. Any one will do, but I guess being orientable helps in this case. Then calculate the unit normal, and then create a Manipulate object that lets you see how the normal behaves:

σ[u_, v_] := {(2 + Cos[v]) Cos[u], (2 + Cos[v]) Sin[u], Sin[v]}
n[u_, v_] := Evaluate[Normalize[
   Cross[D[σ[u, v], u], D[σ[u, v], v]]
   ]]
surfacePlot = 
  ParametricPlot3D[σ[u, v], {u, -Pi, Pi}, {v, -Pi, Pi},
   PlotRangePadding -> 1];
normalPlot = 
  ParametricPlot3D[n[u, v], {u, -Pi, Pi}, {v, -Pi, Pi}, 
   PlotStyle -> Opacity[0.5]];

Manipulate[
 {Show[{
    surfacePlot,
    Graphics3D[{Thick, Red, 
      Arrow[{σ @@ pt, σ @@ pt + n @@ pt}]}]
    }],
  Show[{
    normalPlot,
    Graphics3D[{Thick, Red, Arrow[{{0, 0, 0}, n @@ pt}]}]
    }]
  }
 ,
 {pt, {-Pi, -Pi}, {Pi, Pi}}]

surface and normal

To show the entire vector field for a surface on parametric form you can use a bunch of Arrow's:

Show[{
  surfacePlot,
  Graphics3D[
   Table[
    Arrow[{σ[u, v], σ[u, v] + n[u, v]}],
    {u, -Pi, Pi, 0.4}, {v, -Pi, Pi, 0.4}]
   ]
  }]

vector field

As you can see, the arrows are equally spaced in the parameter space, which leads to uneven distribution of arrows on the surface; it might be worth transforming the parametrization into $f(x,y,z)=0$ form to get a nicer result.

deleted 48 characters in body
Source Link

Let's start with a prametrizedparametrized surface, any. Any one will do, but I guess being orientable helps in this case. Then calculate the unit normal, and then create Manipulatea Manipulate object that lets you see how the normal behaves:

\[Sigma][u_σ[u_, v_] := {(2 + Cos[v]) Cos[u], (2 + Cos[v]) Sin[u], 
  Sin[v]}
n[u_, v_] := Evaluate[Normalize[
   Cross[D[\[Sigma][uCross[D[σ[u, v], u], D[\[Sigma][uD[σ[u, v], v]]
   ]]
surfacePlot = 
  ParametricPlot3D[\[Sigma][uParametricPlot3D[σ[u, v], {u, -Pi, Pi}, {v, -Pi, Pi},
   PlotRangePadding -> 1];
normalPlot = 
  ParametricPlot3D[n[u, v], {u, -Pi, Pi}, {v, -Pi, Pi}, 
   PlotStyle -> Opacity[0.5]];

Manipulate[
 {Show[{
    surfacePlot,
    Graphics3D[{Thick, Red, 
      Arrow[{\[Sigma]σ @@ pt, \[Sigma]σ @@ pt + n @@ pt}]}]
    }],
  Show[{
    normalPlot,
    Graphics3D[{Thick, Red, Arrow[{{0, 0, 0}, n @@ pt}]}]
    }]
  }
 ,
 {pt, {-Pi, -Pi}, {Pi, Pi}}]

surface and normal

To show the entire vector field for a surface on parametric form you can use a bunch of Arrow'sArrow's:

Show[{
  surfacePlot,
  Graphics3D[
   Table[
    Arrow[{\[Sigma][uσ[u, v], \[Sigma][uσ[u, v] + n[u, v]}],
    {u, -Pi, Pi, 0.4}, {v, -Pi, Pi, 0.4}]
   ]
  }]

vector field

As you can see, the arrows are equally spaced in the parameter space, which leads to uneven distribution of arrows on the surface,surface; it might be worth transforming the parametrization into f(x,y,z)=0$f(x,y,z)=0$ form to get a nicer result.

Let's start with a prametrized surface, any one will do but I guess being orientable helps in this case. Then calculate the unit normal, and then create Manipulate object that lets you see how the normal behaves

\[Sigma][u_, v_] := {(2 + Cos[v]) Cos[u], (2 + Cos[v]) Sin[u], 
  Sin[v]}
n[u_, v_] := Evaluate[Normalize[
   Cross[D[\[Sigma][u, v], u], D[\[Sigma][u, v], v]]
   ]]
surfacePlot = 
  ParametricPlot3D[\[Sigma][u, v], {u, -Pi, Pi}, {v, -Pi, Pi},
   PlotRangePadding -> 1];
normalPlot = 
  ParametricPlot3D[n[u, v], {u, -Pi, Pi}, {v, -Pi, Pi}, 
   PlotStyle -> Opacity[0.5]];

Manipulate[
 {Show[{
    surfacePlot,
    Graphics3D[{Thick, Red, 
      Arrow[{\[Sigma] @@ pt, \[Sigma] @@ pt + n @@ pt}]}]
    }],
  Show[{
    normalPlot,
    Graphics3D[{Thick, Red, Arrow[{{0, 0, 0}, n @@ pt}]}]
    }]
  }
 ,
 {pt, {-Pi, -Pi}, {Pi, Pi}}]

surface and normal

To show the entire vector field for a surface on parametric form you can use a bunch of Arrow's:

Show[{
  surfacePlot,
  Graphics3D[
   Table[
    Arrow[{\[Sigma][u, v], \[Sigma][u, v] + n[u, v]}],
    {u, -Pi, Pi, 0.4}, {v, -Pi, Pi, 0.4}]
   ]
  }]

vector field

As you can see the arrows are equally spaced in the parameter space, which leads to uneven distribution of arrows on the surface, might be worth transforming the parametrization into f(x,y,z)=0 form to get a nicer result

Let's start with a parametrized surface. Any one will do, but I guess being orientable helps in this case. Then calculate the unit normal, and then create a Manipulate object that lets you see how the normal behaves:

σ[u_, v_] := {(2 + Cos[v]) Cos[u], (2 + Cos[v]) Sin[u], Sin[v]}
n[u_, v_] := Evaluate[Normalize[
   Cross[D[σ[u, v], u], D[σ[u, v], v]]
   ]]
surfacePlot = 
  ParametricPlot3D[σ[u, v], {u, -Pi, Pi}, {v, -Pi, Pi},
   PlotRangePadding -> 1];
normalPlot = 
  ParametricPlot3D[n[u, v], {u, -Pi, Pi}, {v, -Pi, Pi}, 
   PlotStyle -> Opacity[0.5]];

Manipulate[
 {Show[{
    surfacePlot,
    Graphics3D[{Thick, Red, 
      Arrow[{σ @@ pt, σ @@ pt + n @@ pt}]}]
    }],
  Show[{
    normalPlot,
    Graphics3D[{Thick, Red, Arrow[{{0, 0, 0}, n @@ pt}]}]
    }]
  }
 ,
 {pt, {-Pi, -Pi}, {Pi, Pi}}]

surface and normal

To show the entire vector field for a surface on parametric form you can use a bunch of Arrow's:

Show[{
  surfacePlot,
  Graphics3D[
   Table[
    Arrow[{σ[u, v], σ[u, v] + n[u, v]}],
    {u, -Pi, Pi, 0.4}, {v, -Pi, Pi, 0.4}]
   ]
  }]

vector field

As you can see, the arrows are equally spaced in the parameter space, which leads to uneven distribution of arrows on the surface; it might be worth transforming the parametrization into $f(x,y,z)=0$ form to get a nicer result.

Vector field for parametric form
Source Link
ssch
  • 16.7k
  • 2
  • 54
  • 90

Let's start with a prametrized surface, any one will do but I guess being orientable helps in this case. Then calculate the unit normal, and then create Manipulate object that lets you see how the normal behaves

\[Sigma][u_, v_] := {(2 + Cos[v]) Cos[u], (2 + Cos[v]) Sin[u], 
  Sin[v]}
n[u_, v_] := Evaluate[Normalize[
   Cross[D[\[Sigma][u, v], u], D[\[Sigma][u, v], v]]
   ]]
surfacePlot = 
  ParametricPlot3D[\[Sigma][u, v], {u, -Pi, Pi}, {v, -Pi, Pi},
   PlotRangePadding -> 1];
normalPlot = 
  ParametricPlot3D[n[u, v], {u, -Pi, Pi}, {v, -Pi, Pi}, 
   PlotStyle -> Opacity[0.5]];

Manipulate[
 {Show[{
    surfacePlot,
    Graphics3D[{Thick, Red, 
      Arrow[{\[Sigma] @@ pt, \[Sigma] @@ pt + n @@ pt}]}]
    }],
  Show[{
    normalPlot,
    Graphics3D[{Thick, Red, Arrow[{{0, 0, 0}, n @@ pt}]}]
    }]
  }
 ,
 {pt, {-Pi, -Pi}, {Pi, Pi}}]

surface and normal

To show the entire vector field for a surface on parametric form you can use a bunch of Arrow's:

Show[{
  surfacePlot,
  Graphics3D[
   Table[
    Arrow[{\[Sigma][u, v], \[Sigma][u, v] + n[u, v]}],
    {u, -Pi, Pi, 0.4}, {v, -Pi, Pi, 0.4}]
   ]
  }]

vector field

As you can see the arrows are equally spaced in the parameter space, which leads to uneven distribution of arrows on the surface, might be worth transforming the parametrization into f(x,y,z)=0 form to get a nicer result

Let's start with a prametrized surface, any one will do but I guess being orientable helps in this case. Then calculate the unit normal, and then create Manipulate object that lets you see how the normal behaves

\[Sigma][u_, v_] := {(2 + Cos[v]) Cos[u], (2 + Cos[v]) Sin[u], 
  Sin[v]}
n[u_, v_] := Evaluate[Normalize[
   Cross[D[\[Sigma][u, v], u], D[\[Sigma][u, v], v]]
   ]]
surfacePlot = 
  ParametricPlot3D[\[Sigma][u, v], {u, -Pi, Pi}, {v, -Pi, Pi},
   PlotRangePadding -> 1];
normalPlot = 
  ParametricPlot3D[n[u, v], {u, -Pi, Pi}, {v, -Pi, Pi}, 
   PlotStyle -> Opacity[0.5]];

Manipulate[
 {Show[{
    surfacePlot,
    Graphics3D[{Thick, Red, 
      Arrow[{\[Sigma] @@ pt, \[Sigma] @@ pt + n @@ pt}]}]
    }],
  Show[{
    normalPlot,
    Graphics3D[{Thick, Red, Arrow[{{0, 0, 0}, n @@ pt}]}]
    }]
  }
 ,
 {pt, {-Pi, -Pi}, {Pi, Pi}}]

surface and normal

To show the entire vector field for a surface on parametric form you can use a bunch of Arrow's:

Show[{
  surfacePlot,
  Graphics3D[
   Table[
    Arrow[{\[Sigma][u, v], \[Sigma][u, v] + n[u, v]}],
    {u, -Pi, Pi, 0.4}, {v, -Pi, Pi, 0.4}]
   ]
  }]

vector field

As you can see the arrows are equally spaced in the parameter space, which leads to uneven distribution of arrows on the surface, might be worth transforming the parametrization into f(x,y,z)=0 form to get a nicer result

Source Link
ssch
  • 16.7k
  • 2
  • 54
  • 90
Loading