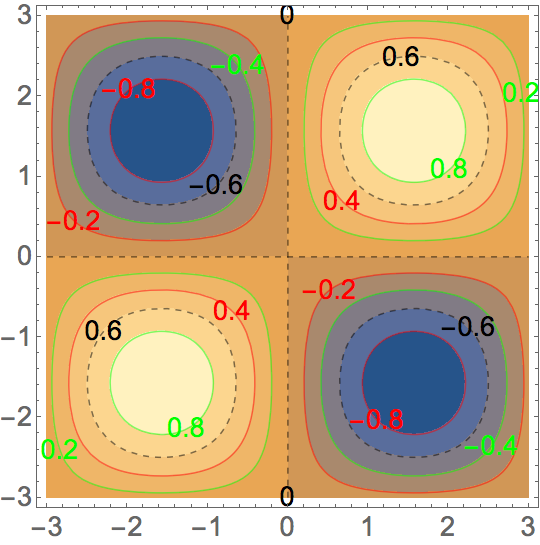
ContourPlot[
 Sin[x] Sin[y],
 {x, -3, 3}, {y, -3, 3},
 ContourStyle -> {Red, Dashed, Green},
 ContourLabels ->
  (Text[Style[#3,
      Switch[#3,
       -0.8 | -0.2 | 0.4, Red,
       -0.6 | 0 | 0.6, Black,
       -0.4 | 0.2 | 0.8, Green]],
     {#1, #2}] &),
 BaseStyle -> 18]
EDIT: If the pure Function using Slot designations is difficult to read, you can write this as
ContourPlot[
 Sin[x] Sin[y],
 {x, -3, 3}, {y, -3, 3},
 ContourStyle -> {Red, Dashed, Green},
 ContourLabels ->
  Function[{x, y, contourValue},
   Text[Style[contourValue,
     Switch[contourValue,
      -0.8 | -0.2 | 0.4, Red,
      -0.6 | 0 | 0.6, Black,
      -0.4 | 0.2 | 0.8, Green]],
    {x, y}]],
 BaseStyle -> 18]
EDIT 2: The default number of contour lines is nine. The contour lines will occur at function values of
lines = Module [{fmin = -1., fmax = 1., fdel},
  fdel = (fmax - fmin)/10;
  Range[fmin + fdel, fmax - fdel, fdel] // Chop]

(*  {-0.8, -0.6, -0.4, -0.2, 0, 0.2, 0.4, 0.6, 0.8}  *)
For a cycle of three colors, the groupings will be
With[{numberOfColors = 3},
 Partition[lines, numberOfColors] // Transpose]

(*  {{-0.8, -0.2, 0.4}, {-0.6, 0, 0.6}, {-0.4, 0.2, 0.8}}  *)
This will obviously change for different function ranges, number of contours, and number of colors.

