edited title
Link
m_goldberg
  • 108.1k
  • 16
  • 104
  • 259

How to find Finding the position ofzero crossing and the end points of the circlearc-like shapesegment of my plot?

deleted 53 characters in body
Source Link
m_goldberg
  • 108.1k
  • 16
  • 104
  • 259
ClearAll["Global`*"]; 

Rep[A_, B_] := Fold[ReplaceAll, A, Flatten[List[B]]]
 
\[Xi]ξ := (-2 a^2 - 2 a^2 r + 6 r^2 - 2 r^3)/(a (-2 + 2 r))
 
\[Eta]η := -((r^3 (-16 a^2 + 36 r - 24 r^2 + 4 r^3))/(a^2 (-2 + 2 r)^2))

{{-\[Xi]ξ, Sqrt[\[Eta]]Sqrt[η]}, {-\[Xi]ξ, -Sqrt[\[Eta]]Sqrt[η]}} // 
  Rep[#, {a -> 2}] & // 
  ParametricPlot[#, {r, -10, 10}, 
   PlotStyle -> {{Thin, Black}, {Thin, Black}}] &

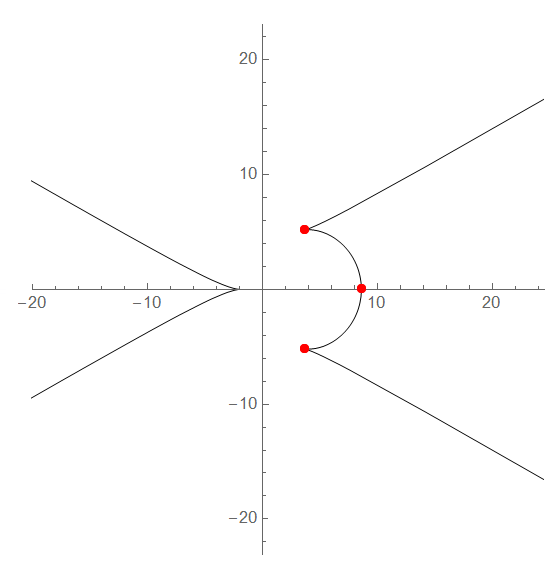
For $1<a<2$ the plot of $-\xi$ and $\sqrt{\eta}$ gives shape similar to

enter image description here

Is there a way to find the position of the end points of the circle-like shape formed for $1<a<2$ marked by two red points in the graph above?

Also, how to find the position of the point where circle-like shape intersects the horizontal axis?

ClearAll["Global`*"];
Rep[A_, B_] := Fold[ReplaceAll, A, Flatten[List[B]]]
 
\[Xi] := (-2 a^2 - 2 a^2 r + 6 r^2 - 2 r^3)/(a (-2 + 2 r))
 
\[Eta] := -((r^3 (-16 a^2 + 36 r - 24 r^2 + 4 r^3))/(a^2 (-2 + 2 r)^2))

{{-\[Xi], Sqrt[\[Eta]]}, {-\[Xi], -Sqrt[\[Eta]]}} // 
  Rep[#, {a -> 2}] & // 
 ParametricPlot[#, {r, -10, 10}, 
   PlotStyle -> {{Thin, Black}, {Thin, Black}}] &

For $1<a<2$ the plot of $-\xi$ and $\sqrt{\eta}$ gives shape similar to

enter image description here

Is there a way to find the position of the end points of the circle-like shape formed for $1<a<2$ marked by two red points in the graph above?

Also, how to find the position of the point where circle-like shape intersects the horizontal axis?

ClearAll["Global`*"]; 

Rep[A_, B_] := Fold[ReplaceAll, A, Flatten[List[B]]]
ξ := (-2 a^2 - 2 a^2 r + 6 r^2 - 2 r^3)/(a (-2 + 2 r))
η := -((r^3 (-16 a^2 + 36 r - 24 r^2 + 4 r^3))/(a^2 (-2 + 2 r)^2))

{{-ξ, Sqrt[η]}, {-ξ, -Sqrt[η]}} // Rep[#, {a -> 2}] & // 
  ParametricPlot[#, {r, -10, 10}, PlotStyle -> {{Thin, Black}, {Thin, Black}}] &

For $1<a<2$ the plot of $-\xi$ and $\sqrt{\eta}$ gives shape similar to

enter image description here

Is there a way to find the position of the end points of the circle-like shape formed for $1<a<2$ marked by two red points in the graph above?

Also, how to find the position of the point where circle-like shape intersects the horizontal axis?

added 23 characters in body; deleted 23 characters in body
Source Link
gbd
  • 409
  • 3
  • 10
Loading
Source Link
gbd
  • 409
  • 3
  • 10
Loading