I have athank you for your explainations. Both of the proposed solutions:
Plot[g[x - a] - g[0] + f[a], {x, a, a+b}] by Michael E2
f3[x_] := Piecewise[{{f1[x], 0 <= x<= 5}, {f2[x - 5], 5 < x <= 20}}] by m_goldberg
look to be promising but as the real problem relatedis a little more complicated and being a newbie with the plot commandmathematica, I'll try to be more specific. In details I want to draw light propagation inside an optical system by using ABCD matrices. As an example, I needdefine three matrices m6,m7 and m8
m6 = {{1, x}, {0, 1}};
m7 = {{1, 0}, {-1/f, 1}};
m8 = {{1, ldl}, {0, 1}};
where x and ldl are distances and f is a fixed numerical value for a lens power.
I use these numerical values:
y0 = 10 10^-6;
t0 = 0 Pi/180;
f = 50 10^-3;
ldlt = 10 10^-2;
xt = 30 10^-2;
Then I want to plot several functions on the sametrends of y1 and y2 given by
{y1, t1} = m8.{y0, t0}
y1t = Table[y1, {ldl, 0, ldlt, ldlt/100 }];
t1t = Table[t1, {ldl, 0, ldlt, ldlt/100 }];
{y2, t2} = m6.m7.{y1t[[101]], t1t[[101]]}.
y1t and t1t are the last values of y0 and t0 vectors. I tried with
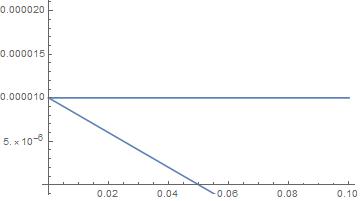
Show[Plot[y1, {ldl, 0, ldlt}], Plot[y2, {x, 0, xt}]]
to plot both of them but doing like this, y2 (and for this I use the Show command….no problems herethe inclined line) but each plotwill always start from the origin must be placed exactly in correspondence toand not from the last point of the previous. Unfortunately, in calculations defining my functionsy1 (so because of the nature of0.1 in the problemattached graph) for each of these functions.
Then, each matrix will use a different name for the starting position must be zero. This implies that I can draw my plots together but they all have origin in zero. Is it possible to addspatial variable, so for exampleme, an extra option to force an offset just to displace the actual plot with respectx is reserved to an other? I looked for this issue in previous answers buta parameter that I could not find something similar. Justwant to give an example,optimize; I have two functions f1 and f2. I need to plot them in cascade so, f1 between [0,5] and f2 between [5,20], but f2 must be calculated20 matrices like this in [0,15]the code. The best I could obtain
So the problem is how to have bothmake each plot start from the end of them in [0,15]. I tried something like Plot[f2,{x,0+ffsetthe previous one ideally by keeping the proper spatial variable name (ldl,15+offset}] but it modifies also data in f2 x, and I don't want this at all...whatever). Thank
Thank you in advance for any help

