replaced http://mathematica.stackexchange.com/ with https://mathematica.stackexchange.com/
Source Link

Possible Duplicate:
Why does ListPlot ignore some global options?Why does ListPlot ignore some global options?

Using this data:

curve = {{0.833, 0.1}, {0.25, 0.08}, {0.5, 0.15}, {1, 0.2}, {2, 
0.3}, {3, 0.45}, {5, 0.75}, {7, 1.25}, {10, 1.85}, {20, 
2.55}, {30, 3}};  

ListPlot with options set inside show plot markers:
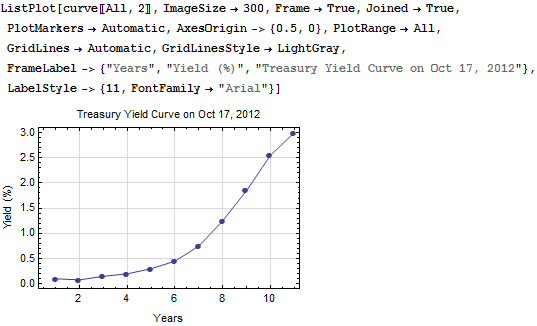
Mathematica graphics

But if I put the exact same options in SetOptions, like this:

SetOptions[ListPlot, ImageSize->300, Frame->True, Joined->True, PlotMarkers->Automatic,
AxesOrigin->{0.5,0}, PlotRange->All, GridLines->Automatic, GridLinesStyle->LightGray,
FrameLabel->{"Years","Yield (%)","Treasury Yield Curve on Oct 17, 2012"},
LabelStyle->{11, FontFamily -> "Arial"}];  

The plot markers disappear. I perfer to keep the (relatively unimportant) options out of posts here, showing only the data, plot function, and results. This annoyance thwarts me.

Possible Duplicate:
Why does ListPlot ignore some global options?

Using this data:

curve = {{0.833, 0.1}, {0.25, 0.08}, {0.5, 0.15}, {1, 0.2}, {2, 
0.3}, {3, 0.45}, {5, 0.75}, {7, 1.25}, {10, 1.85}, {20, 
2.55}, {30, 3}};  

ListPlot with options set inside show plot markers:

Mathematica graphics

But if I put the exact same options in SetOptions, like this:

SetOptions[ListPlot, ImageSize->300, Frame->True, Joined->True, PlotMarkers->Automatic,
AxesOrigin->{0.5,0}, PlotRange->All, GridLines->Automatic, GridLinesStyle->LightGray,
FrameLabel->{"Years","Yield (%)","Treasury Yield Curve on Oct 17, 2012"},
LabelStyle->{11, FontFamily -> "Arial"}];  

The plot markers disappear. I perfer to keep the (relatively unimportant) options out of posts here, showing only the data, plot function, and results. This annoyance thwarts me.

insert duplicate link
Source Link

Possible Duplicate:
Why does ListPlot ignore some global options?

Using this data:

curve = {{0.833, 0.1}, {0.25, 0.08}, {0.5, 0.15}, {1, 0.2}, {2, 
0.3}, {3, 0.45}, {5, 0.75}, {7, 1.25}, {10, 1.85}, {20, 
2.55}, {30, 3}};  

ListPlot with options set inside show plot markers:

Mathematica graphics

But if I put the exact same options in SetOptions, like this:

SetOptions[ListPlot, ImageSize->300, Frame->True, Joined->True, PlotMarkers->Automatic,
AxesOrigin->{0.5,0}, PlotRange->All, GridLines->Automatic, GridLinesStyle->LightGray,
FrameLabel->{"Years","Yield (%)","Treasury Yield Curve on Oct 17, 2012"},
LabelStyle->{11, FontFamily -> "Arial"}];  

The plot markers disappear. I perfer to keep the (relatively unimportant) options out of posts here, showing only the data, plot function, and results. This annoyance thwarts me.

Possible Duplicate:
Why does ListPlot ignore some global options?

Using this data:

curve = {{0.833, 0.1}, {0.25, 0.08}, {0.5, 0.15}, {1, 0.2}, {2, 
0.3}, {3, 0.45}, {5, 0.75}, {7, 1.25}, {10, 1.85}, {20, 
2.55}, {30, 3}};  

ListPlot with options set inside show plot markers:

Mathematica graphics

But if I put the exact same options in SetOptions, like this:

SetOptions[ListPlot, ImageSize->300, Frame->True, Joined->True, PlotMarkers->Automatic,
AxesOrigin->{0.5,0}, PlotRange->All, GridLines->Automatic, GridLinesStyle->LightGray,
FrameLabel->{"Years","Yield (%)","Treasury Yield Curve on Oct 17, 2012"},
LabelStyle->{11, FontFamily -> "Arial"}];  

The plot markers disappear. I perfer to keep the (relatively unimportant) options out of posts here, showing only the data, plot function, and results. This annoyance thwarts me.

Post Closed as "exact duplicate" by Mr.Wizard
Source Link
George Wolfe
  • 5.5k
  • 22
  • 43

Annoyance: Plot Markers disappear when ListPlot options are set in SetOptions instead of in ListPlot

Using this data:

curve = {{0.833, 0.1}, {0.25, 0.08}, {0.5, 0.15}, {1, 0.2}, {2, 
0.3}, {3, 0.45}, {5, 0.75}, {7, 1.25}, {10, 1.85}, {20, 
2.55}, {30, 3}};  

ListPlot with options set inside show plot markers:

Mathematica graphics

But if I put the exact same options in SetOptions, like this:

SetOptions[ListPlot, ImageSize->300, Frame->True, Joined->True, PlotMarkers->Automatic,
AxesOrigin->{0.5,0}, PlotRange->All, GridLines->Automatic, GridLinesStyle->LightGray,
FrameLabel->{"Years","Yield (%)","Treasury Yield Curve on Oct 17, 2012"},
LabelStyle->{11, FontFamily -> "Arial"}];  

The plot markers disappear. I perfer to keep the (relatively unimportant) options out of posts here, showing only the data, plot function, and results. This annoyance thwarts me.