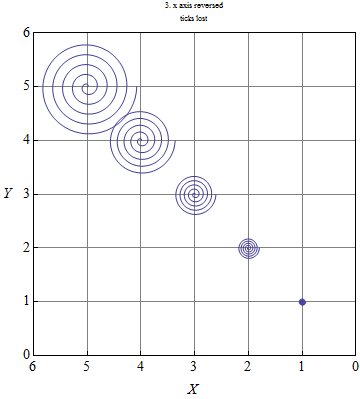
I cannot recall a built-in method to reverse an axis, at least for ParametricPlot, but maybe the right FrameTicks syntax will help:
ticks = {{{-6, 6}, {-5, 5}, {-4, 4}, {-3, 3}, {-2, 2}, {-1, 1}, {0, 0}}, {{0,
   0}, {1, 1}, {2, 2}, {3, 3}, {4, 4}, {5, 5}, {6, 6}}, {}, {}};

ParametricPlot[
 spiral[.002*#^(5/3), t, -#, #] & /@ Range[objects], {t, 0, 10*\[Pi]},
  PlotRange -> {{-objects - 1, 0}, {0, objects + 1}},
 PlotLabel -> Style["3. x axis reversed\nticks lost", FontSize -> fs],
  Frame -> True, FrameLabel -> fl, GridLines -> Automatic,
 FrameTicks -> ticks]

It's possible that this version-8 function may work with ParametricPlot, though I can't test that, and ParametricPlot doesn't appear to be supported: ScalingFunctions
Update
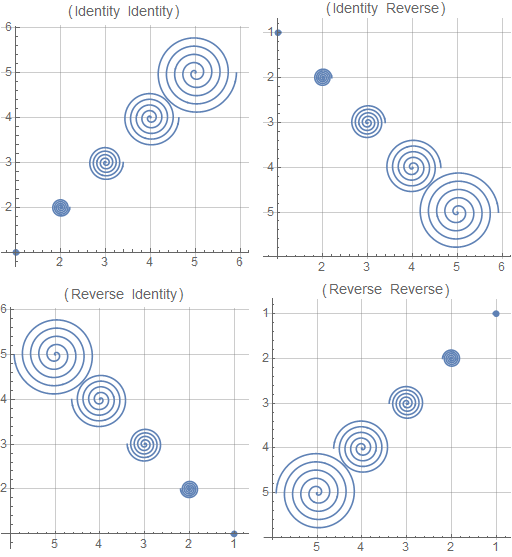
In Mathematica 10 ScalingFunctions does work with ParametricPlot, though it is undocumented.
Table[
spiral[a_, t_, ParametricPlot[spiral[x_, y_] := {a*t*Cos[t] + x, a*t*Sin[t] + y};

ParametricPlot[
 spiral[.002*#^(5/3), t, #, #] & /@ Range[objects]Range[5]
 , {t, 0, 10*Pi},
 , GridLines -> Automatic
 , ScalingFunctions -> sfn#
 , PlotLabel -> {sfn}],
 {sfn,
    {{Identity, Identity#},
  ] & /@ Tuples[{Identity, "Reverse"},
     {"Reverse", Identity},
     {"Reverse", "Reverse"}}
 }
]2]

