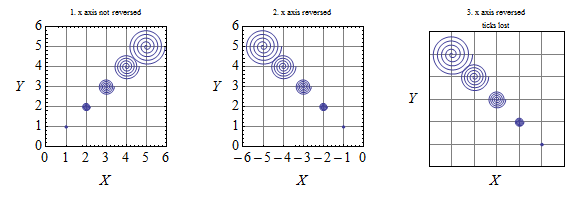
In astronomy, right ascension is usually plotted with positive values that increase from right to left. I have seen discussions of successful and unsuccessful attempts to reverse the order of an axis in MathematicaMathematica, but I haven't seen anything that applies specifically to the ParametricPlotParametricPlot[] function, and perhaps I am not good enough at MMAMathematica to see how the other solutions using ScalingFunctionsScalingFunctions or TransposeTranspose might be applied here. I tried a few to no avail.
Plot 2 uses the default frame ticks, showing reversal of plotting order by reversing the signs of the x coordinates$x$-coordinates of the plot objects. In the TicksTicks option, their specs seem to be ordered {{left, right}, {bottom, top}}{{left, right}, {bottom, top}} with respect to the frame sides. I believe that replacing one of these terms, say left, with something like {-1, 1}{-1, 1} would replace -1-1 with 11 on the left side. But when I attempted to change the names of the ticks on the x axis$x$-axis in plot 2 to positive numbers, the ticks and their names both disappeared, as in plot 3. I could replace the missing ticks with a cumbersome EpilogEpilog list, but I would prefer something more elegant. It strikes me as odd that the mathematicians who created MathematicaMathematica would arbitrarily limit their orientation, so there must be a native way of reversing order. No, no? The following three scripts produce these three plots in a row:


Clear["Global`*"]

spiral[a_, t_, x_, y_] := {a*t*Cos[t] + x, a*t*Sin[t] + y} // N;

fs = 8; (*font* size*font size *)
objects=5;objects = 5;
fl=fl = {X, Rotate[Y, -Pi/2]}; (*frame* label*frame label *)

unreversed =
 ParametricPlot[
  spiral[.002*#^(5/3), t, #, #] & /@ Range[objects], {t, 0, 10*\[Pi]10*Pi},
   PlotRange -> {{0, objects + 1}, {0, objects + 1}},
   PlotLabel -> Style["1. x axis not reversed", FontSize -> fs],
   Frame -> True, FrameLabel -> fl, GridLines -> Automatic];

reversed1 =
  ParametricPlot[
   spiral[.002*#^(5/3), t, -#, #] & /@ Range[objects], {t, 0,
    10*\[Pi]10*Pi}, PlotRange -> {{-objects - 1, 0}, {0, objects + 1}},
   PlotLabel -> Style["2. x axis reversed", FontSize -> fs],
   Frame -> True, FrameLabel -> fl, GridLines -> Automatic];

ticks = {{Automatic, None}, {{-#, #}, None}} & /@
   Reverse[Range[objects]];

reversed2 =
  ParametricPlot[
   spiral[.002*#^(5/3), t, -#, #] & /@ Range[objects], {t, 0,
    10*\[Pi]10*Pi}, PlotRange -> {{-objects - 1, 0}, {0, objects + 1}},
   PlotLabel ->
    Style["3. x axis reversed\nticks lost", FontSize -> fs],
   Frame -> True, FrameLabel -> fl, GridLines -> Automatic,
   FrameTicks -> ticks (*causes* causes ticks to disappear*disappear *)];

GraphicsRow[{unreversed, reversed1, reversed2}]
