Commonmark migration
Source Link

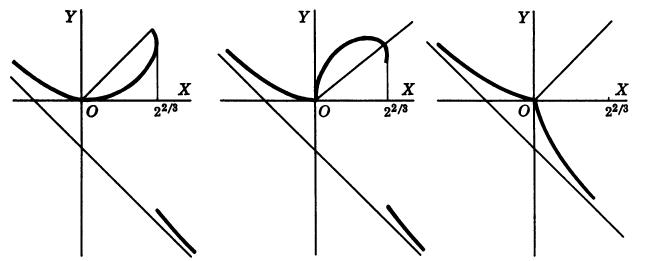
First of all, good day and thanks for taking the time to read this question. The problem I'm having, is how i can plot just sections of the Folia of Descartes graph, which is build from the equation:

$x^3 + y^3 - 3xy=0$

I'm trying to do the representations that Morris Tenenbaum and Harry Pollard do, in their Ordinary differential equation book, page 17.

[![enter image description here][1]][1]Soenter image description hereSo far i can do the plot of the Folia of Descartes using:
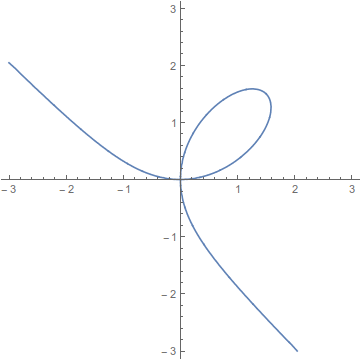
ContourPlot[x^3 + y^3 - 3 x y == 0, {x, -3, 3}, {y, -3, 3}, Axes -> True, Frame -> False]

[![enter image description here][2]][2]enter image description here
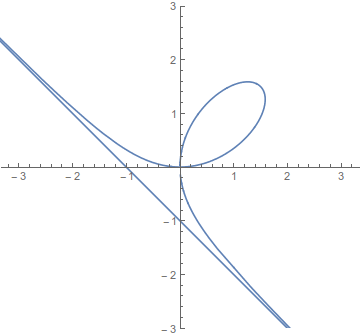
And parametric plot:

ParametricPlot[{(3 m)/(1 + m^3), (3 m^2)/(1 + m^3)}, {m, -20, 80},PlotRange -> {-3, 3}]

[![enter image description here][3]][3]enter image description here
Now i know that the option RegionFunction of the Function ParametricPlot could help for this, however i have failed in getting the sections.

I'm looking for any pointers or ideas on how to do the sections of the folia of descartes.

PS: My English isn't that good so I hope i explain my self good enough while making this question. Thanks again and have a good day. [1]: https://i.sstatic.net/921l4.jpg [2]: https://i.sstatic.net/oP0Zy.gif [3]: https://i.sstatic.net/akTaY.gif

First of all, good day and thanks for taking the time to read this question. The problem I'm having, is how i can plot just sections of the Folia of Descartes graph, which is build from the equation:

$x^3 + y^3 - 3xy=0$

I'm trying to do the representations that Morris Tenenbaum and Harry Pollard do, in their Ordinary differential equation book, page 17.

[![enter image description here][1]][1]So far i can do the plot of the Folia of Descartes using:

ContourPlot[x^3 + y^3 - 3 x y == 0, {x, -3, 3}, {y, -3, 3}, Axes -> True, Frame -> False]

[![enter image description here][2]][2]

And parametric plot:

ParametricPlot[{(3 m)/(1 + m^3), (3 m^2)/(1 + m^3)}, {m, -20, 80},PlotRange -> {-3, 3}]

[![enter image description here][3]][3]

Now i know that the option RegionFunction of the Function ParametricPlot could help for this, however i have failed in getting the sections.

I'm looking for any pointers or ideas on how to do the sections of the folia of descartes.

PS: My English isn't that good so I hope i explain my self good enough while making this question. Thanks again and have a good day. [1]: https://i.sstatic.net/921l4.jpg [2]: https://i.sstatic.net/oP0Zy.gif [3]: https://i.sstatic.net/akTaY.gif

First of all, good day and thanks for taking the time to read this question. The problem I'm having, is how i can plot just sections of the Folia of Descartes graph, which is build from the equation:

$x^3 + y^3 - 3xy=0$

I'm trying to do the representations that Morris Tenenbaum and Harry Pollard do, in their Ordinary differential equation book, page 17.

enter image description hereSo far i can do the plot of the Folia of Descartes using:

ContourPlot[x^3 + y^3 - 3 x y == 0, {x, -3, 3}, {y, -3, 3}, Axes -> True, Frame -> False]

enter image description here

And parametric plot:

ParametricPlot[{(3 m)/(1 + m^3), (3 m^2)/(1 + m^3)}, {m, -20, 80},PlotRange -> {-3, 3}]

enter image description here

Now i know that the option RegionFunction of the Function ParametricPlot could help for this, however i have failed in getting the sections.

I'm looking for any pointers or ideas on how to do the sections of the folia of descartes.

PS: My English isn't that good so I hope i explain my self good enough while making this question. Thanks again and have a good day.

edited tags
Link
Source Link
Leothan
  • 309
  • 1
  • 6

Folia of Descartes section plots

First of all, good day and thanks for taking the time to read this question. The problem I'm having, is how i can plot just sections of the Folia of Descartes graph, which is build from the equation:

$x^3 + y^3 - 3xy=0$

I'm trying to do the representations that Morris Tenenbaum and Harry Pollard do, in their Ordinary differential equation book, page 17.

[![enter image description here][1]][1]So far i can do the plot of the Folia of Descartes using:

ContourPlot[x^3 + y^3 - 3 x y == 0, {x, -3, 3}, {y, -3, 3}, Axes -> True, Frame -> False]

[![enter image description here][2]][2]

And parametric plot:

ParametricPlot[{(3 m)/(1 + m^3), (3 m^2)/(1 + m^3)}, {m, -20, 80},PlotRange -> {-3, 3}]

[![enter image description here][3]][3]

Now i know that the option RegionFunction of the Function ParametricPlot could help for this, however i have failed in getting the sections.

I'm looking for any pointers or ideas on how to do the sections of the folia of descartes.

PS: My English isn't that good so I hope i explain my self good enough while making this question. Thanks again and have a good day. [1]: https://i.sstatic.net/921l4.jpg [2]: https://i.sstatic.net/oP0Zy.gif [3]: https://i.sstatic.net/akTaY.gif