added 80 characters in body
Source Link
Alexey Popkov
  • 62.3k
  • 7
  • 154
  • 375

Bug introduced in 8 or earlier and persists through 11.0.0


I have encountered some strange behavior on the part of the front-end.

$Version

"10.4.1 for Mac OS X x86 (64-bit) (April 11, 2016)"

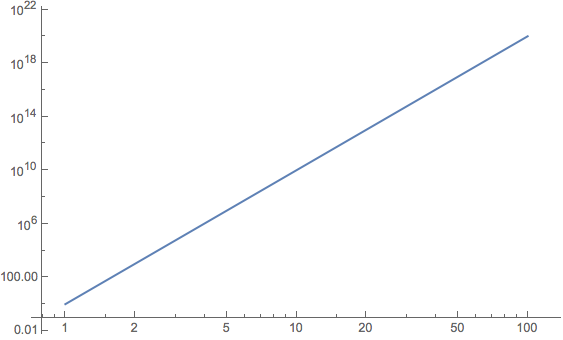
Start with a simple log-log plot.

plot = LogLogPlot[x^10, {x, 1, 100}, ImageSize -> 450]

plot

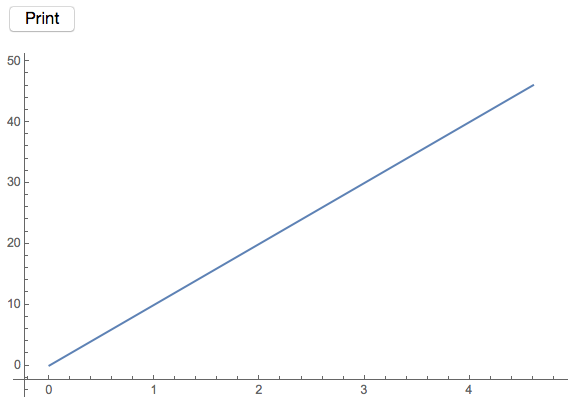
But when I make a button to show the plot

Button["Print", Print[plot]]

and click on it

badplot

The tick labels are wrong. However, it gets weirder. When I copy the above plot and paste it back into the notebook, the pasted version is correct. This convinces me that this is front-end misbehavior.

Why does the front-end render the plot ticks incorrectly if and only if the plot is rendered by calling Print[plot] in a button's action? (I have confirmed that it does not happen when I evaluate Print[plot] at top-level.)

Also, can other's confirm this behavior persists in V11 (which I don't have)? I think this is a front-end bug, but it might be corrected in V11.
Bug introduced in 8 or earlier and persists through 11.0.0


I have encountered some strange behavior on the part of the front-end.

$Version

"10.4.1 for Mac OS X x86 (64-bit) (April 11, 2016)"

Start with a simple log-log plot.

plot = LogLogPlot[x^10, {x, 1, 100}, ImageSize -> 450]

plot

But when I make a button to show the plot

Button["Print", Print[plot]]

and click on it

badplot

The tick labels are wrong. However, it gets weirder. When I copy the above plot and paste it back into the notebook, the pasted version is correct. This convinces me that this is front-end misbehavior.

Why does the front-end render the plot ticks incorrectly if and only if the plot is rendered by calling Print[plot] in a button's action? (I have confirmed that it does not happen when I evaluate Print[plot] at top-level.)

Also, can other's confirm this behavior persists in V11 (which I don't have)? I think this is a front-end bug, but it might be corrected in V11.

edited tags
Link
Alexey Popkov
  • 62.3k
  • 7
  • 154
  • 375
edited tags
Link
Alexey Popkov
  • 62.3k
  • 7
  • 154
  • 375
edited tags
Link
m_goldberg
  • 108.1k
  • 16
  • 104
  • 259
Loading
Tweeted twitter.com/StackMma/status/773453552152903681
Source Link
m_goldberg
  • 108.1k
  • 16
  • 104
  • 259
Loading