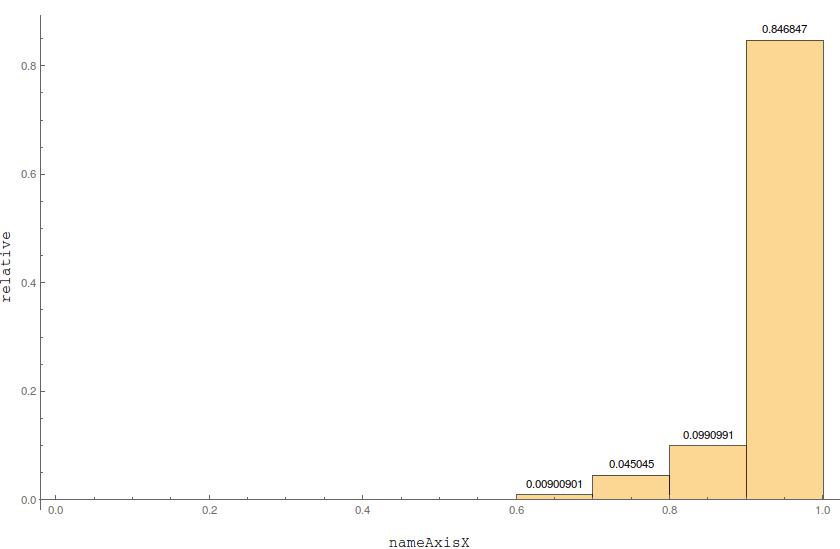
A complementary approach to @Jim Baldwin's answer would be to slightly increase the size of the last bin instead of manipulating the data:
(* Generate some data from a beta distribution *)
data = RandomVariate[BetaDistribution[10, 0.5], 100];
(* Add some 1's *)
data = Flatten[{data, {1, 1, 1, 1, 1, 1, 1, 1, 1, 1, 1}}];
Define the bins (I guess this can be made more elegant, but it's straightforward enough for the current purpose):
Width = Join[Table[i, {i, 0, 0.9, 0.1}], {1.0001}];
Then your plot:
Labeled[Histogram[{data}, {Width}, "Probability",
  LabelingFunction -> Above, ImageSize -> {820, 530},
  PlotRange -> All], {Rotate["relative", 90 Degree],
  nameAxisX}, {Left, Bottom}]
produces
where the rightmost bins' size is visually undistinguishable from the other ones.
One can try to make it a bit more automatic, e.g.
Width = Join[Table[i, {i, 0, 0.9, 0.1}], {Max[data]+0.0001}];
and so on.

