Styling improved
Source Link
user31159
user31159

I have a format issue with my histogram.

First of all my command:

Labeled [Histogram[{data},{Width},"Probability",LabelingFunction->Above,ImageSize->{820,530},PlotRange->All],{Rotate["relative",90 Degree],nameAxisX},{Left,Bottom}]

I have data in a set ofthe interval [0,1] which I have grouped in classes with Width = 0,1.

The data are counted correctly. Unfortunately the histogram doesn't start at 0.0 and it extends by 1.0; or - most surely - it is moved to right so that it looks like it is extending.

I have attached my diagramme so that you will see what I am speaking about.

What I would like to have: every bar of the histogram in its own interval from 0.0-0.1, 0.1-0.2, ..., 0.9-1.0.

Thank you.

enter image description here

I have a format issue with my histogram.

First of all my command:

Labeled [Histogram[{data},{Width},"Probability",LabelingFunction->Above,ImageSize->{820,530},PlotRange->All],{Rotate["relative",90 Degree],nameAxisX},{Left,Bottom}]

I have data in a set of [0,1] which I have grouped in classes with Width = 0,1.

The data are counted correctly. Unfortunately the histogram doesn't start at 0.0 and it extends by 1.0; or - most surely - it is moved to right so that it looks like it is extending.

I have attached my diagramme so that you will see what I am speaking about.

What I would like to have: every bar of the histogram in its own interval from 0.0-0.1, 0.1-0.2, ..., 0.9-1.0.

enter image description here

I have a format issue with my histogram.

First of all my command:

Labeled [Histogram[{data},{Width},"Probability",LabelingFunction->Above,ImageSize->{820,530},PlotRange->All],{Rotate["relative",90 Degree],nameAxisX},{Left,Bottom}]

I have data in the interval [0,1] which I have grouped in classes with Width = 0,1.

The data are counted correctly. Unfortunately the histogram doesn't start at 0.0 and it extends by 1.0; or - most surely - it is moved to right so that it looks like it is extending.

I have attached my diagramme so that you will see what I am speaking about.

What I would like to have: every bar of the histogram in its own interval from 0.0-0.1, 0.1-0.2, ..., 0.9-1.0.

Thank you.
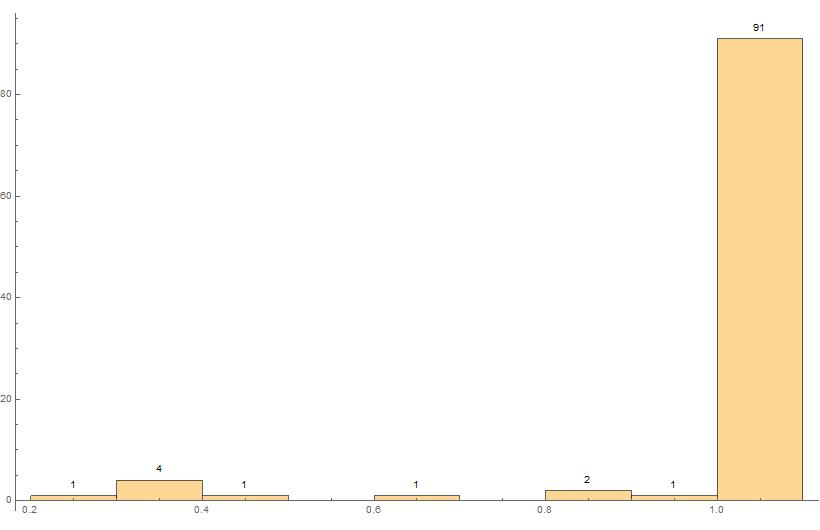
enter image description here

Histogramm Histogram: Format issue

iI have a format issue with my histogrammhistogram.

firstFirst of all my command:

Labeled [Histogram[{data},{Width},"Probability",LabelingFunction->Above,ImageSize->{820,530},PlotRange->All],{Rotate["relative",90 Degree],nameAxisX},{Left,Bottom}]

I have data in a set betweenof [0,1] which iI have grouped in classes with width = 0,1Width = 0,1.

The data are counted correctly. UnfortunatlyUnfortunately the histogramm doesnthistogram doesn't start at 0,000.0 and it extends by 1,0;1.0; or - most surely - it is moved to right so that iit looks like it is extending.

iI have attached my diagrammdiagramme so that you will see what iI am speaking about.

what iWhat I would like to have: every bar of the histogram in its own intervallinterval from 00.0-0.1,00-0 0.1-0.2,1 ....0,1-0,2... 0.9-1.0.0,9-1,0

Thank you

enter image description here

Histogramm: Format issue

i have a format issue with my histogramm.

first of all my command:

Labeled [Histogram[{data},{Width},"Probability",LabelingFunction->Above,ImageSize->{820,530},PlotRange->All],{Rotate["relative",90 Degree],nameAxisX},{Left,Bottom}]

I have data in a set between [0,1] which i have grouped in classes with width = 0,1

The data are counted correctly. Unfortunatly the histogramm doesnt start at 0,00 and it extends by 1,0; or - most surely - it is moved to right so that i looks like it is extending.

i have attached my diagramm so that you will see what i am speaking about.

what i would like to have: every bar of the histogram in its own intervall from 0,00-0,1 ....0,1-0,2....0,9-1,0

Thank you

enter image description here

Histogram: Format issue

I have a format issue with my histogram.

First of all my command:

Labeled [Histogram[{data},{Width},"Probability",LabelingFunction->Above,ImageSize->{820,530},PlotRange->All],{Rotate["relative",90 Degree],nameAxisX},{Left,Bottom}]

I have data in a set of [0,1] which I have grouped in classes with Width = 0,1.

The data are counted correctly. Unfortunately the histogram doesn't start at 0.0 and it extends by 1.0; or - most surely - it is moved to right so that it looks like it is extending.

I have attached my diagramme so that you will see what I am speaking about.

What I would like to have: every bar of the histogram in its own interval from 0.0-0.1, 0.1-0.2, ..., 0.9-1.0.

enter image description here

deleted 23 characters in body
Source Link

i have a format issue with my histogramm.

first of all my command:

Labeled [Histogram[{data},{classWidthRoundedWidth},"Probability",LabelingFunction->Above,ImageSize->{820,530},PlotRange->All],{Rotate["Relative Häufigkeit"Rotate["relative",90 Degree],nameAxisX},{Left,Bottom}]

I have data in a set between [0,1] which i have grouped in classes with width = 0,1

The data are counted correctly. Unfortunatly the histogramm doesnt start at 0,00 and it extends by 1,0; or - most surely - it is moved to right so that i looks like it is extending.

i have attached my diagramm so that you will see what i am speaking about.

what i would like to have: every bar of the histogram in its own intervall from 0,00-0,1 ....0,1-0,2....0,9-1,0

Thank you

enter image description here

i have a format issue with my histogramm.

first of all my command:

Labeled [Histogram[{data},{classWidthRounded},"Probability",LabelingFunction->Above,ImageSize->{820,530},PlotRange->All],{Rotate["Relative Häufigkeit",90 Degree],nameAxisX},{Left,Bottom}]

I have data in a set between [0,1] which i have grouped in classes with width = 0,1

The data are counted correctly. Unfortunatly the histogramm doesnt start at 0,00 and it extends by 1,0; or - most surely - it is moved to right so that i looks like it is extending.

i have attached my diagramm so that you will see what i am speaking about.

what i would like to have: every bar of the histogram in its own intervall from 0,00-0,1 ....0,1-0,2....0,9-1,0

Thank you

enter image description here

i have a format issue with my histogramm.

first of all my command:

Labeled [Histogram[{data},{Width},"Probability",LabelingFunction->Above,ImageSize->{820,530},PlotRange->All],{Rotate["relative",90 Degree],nameAxisX},{Left,Bottom}]

I have data in a set between [0,1] which i have grouped in classes with width = 0,1

The data are counted correctly. Unfortunatly the histogramm doesnt start at 0,00 and it extends by 1,0; or - most surely - it is moved to right so that i looks like it is extending.

i have attached my diagramm so that you will see what i am speaking about.

what i would like to have: every bar of the histogram in its own intervall from 0,00-0,1 ....0,1-0,2....0,9-1,0

Thank you

enter image description here

Source Link
Loading