If you are attempting to solve ODEs one through five in sequence, one way to do so is
GraphicsGrid[{Table[s = NDSolve[eqns[[n]], vars[[n]], {t, 0, 50T}];
    Plot[Evaluate[vars[[n]] /. s], {t, 0, 50T}, PlotRange -> All], {n, 5}]},
    ImageSize -> Large]
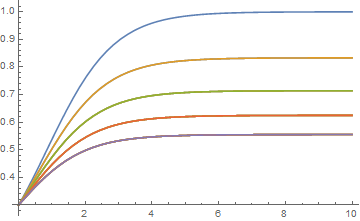
Alternatively, the solutions can be presented in a single plot.
Show @@ Table[s = NDSolve[eqns[[n]], vars[[n]], {t, 0, T}];
    Plot[Evaluate[vars[[n]] /. s], {t, 0, T}, PlotRange -> All], {n, 5}]
Not surprisingly, all curves for each value of n coincide.


