deleted 125 characters in body
Source Link
Young
  • 7.5k
  • 1
  • 22
  • 46

Using FindClusters to group the pixels

coord = FindClusters[PixelValuePositions[imagemFindClusters[ImageValuePositions[imagem, Red], 5];
coord = Table[Mean[coord[[i]]], {i, 1, 5}]
ListPlot[coord]

{{73/236., 409/2204.}, {695/2347., 369/2184.}, {301/2150., 299/2149.}, {493/2246., 153/276.}, {143/ 271., 79/239.}}

enter image description hereenter image description here

Show[
 imagem,
 Graphics[
  Line[{{coord[[1]], coord[[3]]}, {coord[[4]], 
     coord[[3]]}, {coord[[2]], coord[[3]]}Graphics@Line@Subsets[#, {coord[[5]], coord[[3]]}2}]]
 ] &@coord]

enter image description hereenter image description here

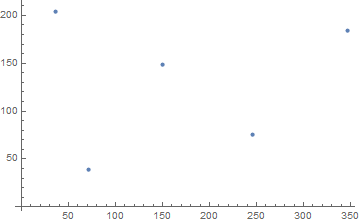
Using FindClusters to group the pixels

coord = FindClusters[PixelValuePositions[imagem, Red], 5];
coord = Table[Mean[coord[[i]]], {i, 1, 5}]
ListPlot[coord]

{{73/2, 409/2}, {695/2, 369/2}, {301/2, 299/2}, {493/2, 153/2}, {143/ 2, 79/2}}

enter image description here

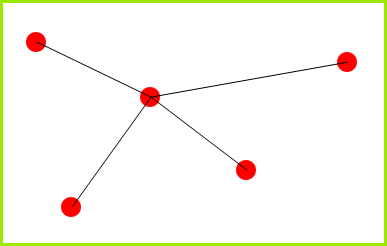
Show[
 imagem,
 Graphics[
  Line[{{coord[[1]], coord[[3]]}, {coord[[4]], 
     coord[[3]]}, {coord[[2]], coord[[3]]}, {coord[[5]], coord[[3]]}}]]
 ]

enter image description here

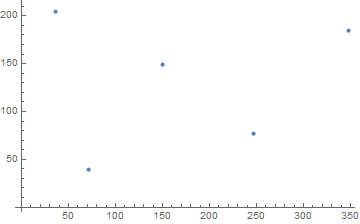
Using FindClusters to group the pixels

coord = FindClusters[ImageValuePositions[imagem, Red], 5];
coord = Table[Mean[coord[[i]]], {i, 1, 5}]
ListPlot[coord]

{{36., 204.}, {347., 184.}, {150., 149.}, {246., 76.}, {71., 39.}}

enter image description here

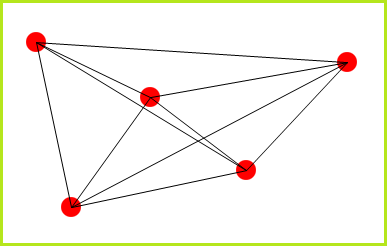
Show[
 imagem,
 Graphics@Line@Subsets[#, {2}] &@coord]

enter image description here

Source Link
Young
  • 7.5k
  • 1
  • 22
  • 46

Using FindClusters to group the pixels

coord = FindClusters[PixelValuePositions[imagem, Red], 5];
coord = Table[Mean[coord[[i]]], {i, 1, 5}]
ListPlot[coord]

{{73/2, 409/2}, {695/2, 369/2}, {301/2, 299/2}, {493/2, 153/2}, {143/ 2, 79/2}}

enter image description here

Show[
 imagem,
 Graphics[
  Line[{{coord[[1]], coord[[3]]}, {coord[[4]], 
     coord[[3]]}, {coord[[2]], coord[[3]]}, {coord[[5]], coord[[3]]}}]]
 ]

enter image description here