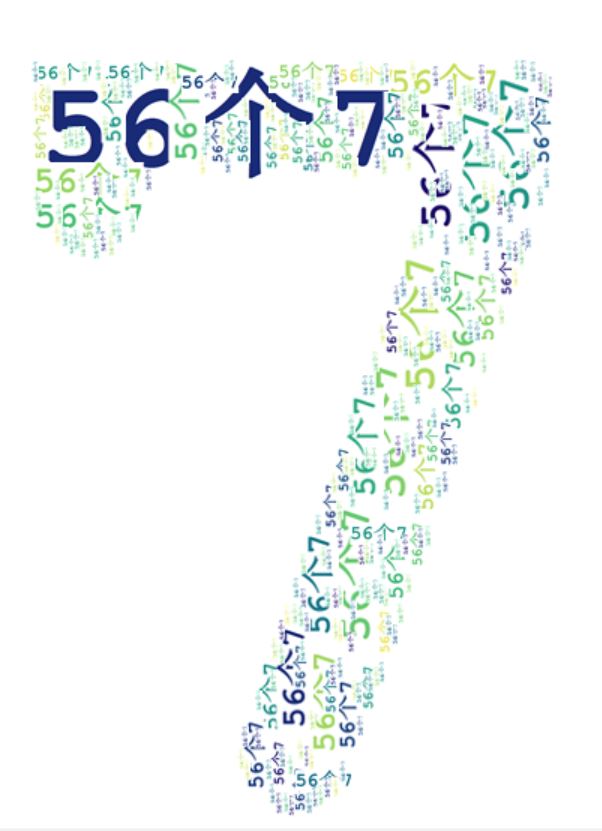
First, I'll have to admit that those data should be modified a bit:
wd2="56个7";
dat={{#1[[1]], -#1[[2]]}, #2} & @@@ Map[Reverse, **Those data**, {2}];
Then, just following @Sumit's answer, we'll have to use Inset to do this job, but we need to further specify the alignment by using Inset's Third options. Then, we also need to use the size option(the fourth option) in Inset to make the graphics in our desired form.
In this way, we can easily rule out the actual form of the code:
Graphics[Inset[
    Rasterize[
     Style[wd2, ColorData["BlueGreenYellow"]@RandomReal[], Bold,
      FontFamily -> Times], RasterSize -> 1000], #1, {Left, Top}, #2,
    If[#2[[1]] > #2[[2]], {1, 0}, {0, 1}]] & @@@ dat,
 PlotRange -> {{0, 1000}, {-2000, 0}}, ImageSize -> 800]
Though the result is still not satisfying, I think I'll post this first in hope that someone may further improve this code.
#Edit 1
Edit 1
The alignment and size needs a bit more formatting while the text is rotated as these options will only specify the points before rotation:
Graphics[Inset[
    Rasterize[
     Style[wd2, ColorData["BlueGreenYellow"]@RandomReal[], Bold],
     RasterSize -> 1000], #1,
    If[#2[[1]] > #2[[2]], {Left, Top}, {Right, Top}], Reverse@Sort@#2,
     If[#2[[1]] > #2[[2]], {1, 0}, {0, 1}]] & @@@ dat,
 PlotRange -> {{0, 1000}, {-2000, 0}}, ImageSize -> 800]
This time the result will be quite pleasing, and the only thing left is about opacity. Thanks for everyone!!!

