added 346 characters in body
Source Link
Yves Klett
  • 15.5k
  • 5
  • 58
  • 125

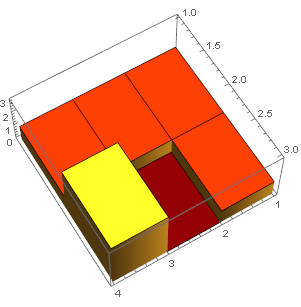
This is not entirely the same, as it changes coloring and z-scaling, but perhaps something similar may be of help. Essentially, the zero values are lifted by a small increment, while the original z-range is preserved.

data = {{1, 1, 1, 1}, {1, 0, 3, 1}, {2, 0, 0, 1}};
ListPlot3D[data /. x_ /; x < .01 -> 0.01, Mesh -> None, 
 InterpolationOrder -> 0, Filling -> Bottom, 
 FillingStyle -> {Opacity[1]}, ColorFunction -> "SolarColors", 
 ViewPoint -> {Pi, Pi, 5}, 
 PlotRange -> {Automatic, Automatic, {Min[data], Max[data]}}]
Mathematica graphicsEDIT

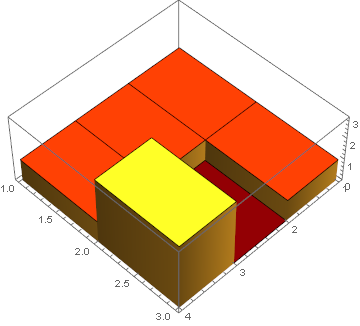
even better (shorter and broader applicability) as proposed by the OP:

ListPlot3D[data, Mesh -> None, InterpolationOrder -> 0, 
 Filling -> Bottom, FillingStyle -> {Opacity[1]}, 
 ColorFunction -> "SolarColors", ViewPoint -> {Pi, Pi, 5}, 
 PlotRange -> {Automatic, Automatic, {Min[data] - 0.01, Max[data]}}]
Mathematica graphics

This is not entirely the same, as it changes coloring and z-scaling, but perhaps something similar may be of help. Essentially, the zero values are lifted by a small increment, while the original z-range is preserved.

data = {{1, 1, 1, 1}, {1, 0, 3, 1}, {2, 0, 0, 1}};
ListPlot3D[data /. x_ /; x < .01 -> 0.01, Mesh -> None, 
 InterpolationOrder -> 0, Filling -> Bottom, 
 FillingStyle -> {Opacity[1]}, ColorFunction -> "SolarColors", 
 ViewPoint -> {Pi, Pi, 5}, 
 PlotRange -> {Automatic, Automatic, {Min[data], Max[data]}}]

EDIT

even better (shorter and broader applicability) as proposed by the OP:

ListPlot3D[data, Mesh -> None, InterpolationOrder -> 0, 
 Filling -> Bottom, FillingStyle -> {Opacity[1]}, 
 ColorFunction -> "SolarColors", ViewPoint -> {Pi, Pi, 5}, 
 PlotRange -> {Automatic, Automatic, {Min[data] - 0.01, Max[data]}}]

Mathematica graphics

Source Link
Yves Klett
  • 15.5k
  • 5
  • 58
  • 125

This is not entirely the same, as it changes coloring and z-scaling, but perhaps something similar may be of help. Essentially, the zero values are lifted by a small increment, while the original z-range is preserved.

data = {{1, 1, 1, 1}, {1, 0, 3, 1}, {2, 0, 0, 1}};
ListPlot3D[data /. x_ /; x < .01 -> 0.01, Mesh -> None, 
 InterpolationOrder -> 0, Filling -> Bottom, 
 FillingStyle -> {Opacity[1]}, ColorFunction -> "SolarColors", 
 ViewPoint -> {Pi, Pi, 5}, 
 PlotRange -> {Automatic, Automatic, {Min[data], Max[data]}}]

Mathematica graphics