added 286 characters in body
Source Link
george2079
  • 39.1k
  • 1
  • 44
  • 111

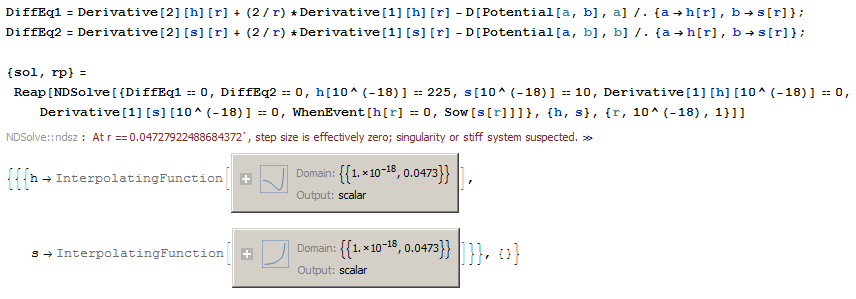
I guess this is worth explaining a little better. Here is what I get running the exact code:

enter image description here

You can see the error message and the domain say the integration stopped around 0.0473.

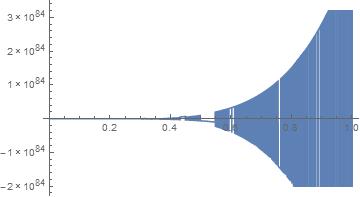
The trouble arises here, if you don't notice that and plot over your specified range

 Plot[h[r] /. First@sol, {r, 10^-18, 1}]

enter image description here

you get a plot, but its just garbage past the error point. Why this is allowed baffles me. Note if you request a specific value, eg h[.05] /. First@sol you get a warning:

"Input value {0.05`} lies outside the range of data in the interpolating function. Extrapolation will be used. "

For some reason Plot does not give that warning.

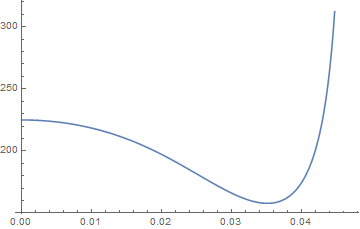
Here is the actual solution:

 Plot[h[r] /. First@sol, {r, 
    10^-18, (h /. First@sol)["Domain"][[1, 2]]}]

which you see is always positive.

enter image description here

I guess this is worth explaining a little better. Here is what I get running the exact code:

enter image description here

You can see the error message and the domain say the integration stopped around 0.0473.

The trouble arises here, if you don't notice that and plot over your specified range

 Plot[h[r] /. First@sol, {r, 10^-18, 1}]

enter image description here

you get a plot, but its just garbage past the error point.

Here is the actual solution:

 Plot[h[r] /. First@sol, {r, 
    10^-18, (h /. First@sol)["Domain"][[1, 2]]}]

which you see is always positive.
enter image description here

I guess this is worth explaining a little better. Here is what I get running the exact code:

enter image description here

You can see the error message and the domain say the integration stopped around 0.0473.

The trouble arises here, if you don't notice that and plot over your specified range

 Plot[h[r] /. First@sol, {r, 10^-18, 1}]

enter image description here

you get a plot, but its just garbage past the error point. Why this is allowed baffles me. Note if you request a specific value, eg h[.05] /. First@sol you get a warning:

"Input value {0.05`} lies outside the range of data in the interpolating function. Extrapolation will be used. "

For some reason Plot does not give that warning.

Here is the actual solution:

 Plot[h[r] /. First@sol, {r, 
    10^-18, (h /. First@sol)["Domain"][[1, 2]]}]

which you see is always positive.
enter image description here

Source Link
george2079
  • 39.1k
  • 1
  • 44
  • 111

I guess this is worth explaining a little better. Here is what I get running the exact code:

enter image description here

You can see the error message and the domain say the integration stopped around 0.0473.

The trouble arises here, if you don't notice that and plot over your specified range

 Plot[h[r] /. First@sol, {r, 10^-18, 1}]

enter image description here

you get a plot, but its just garbage past the error point.

Here is the actual solution:

 Plot[h[r] /. First@sol, {r, 
    10^-18, (h /. First@sol)["Domain"][[1, 2]]}]

which you see is always positive.
enter image description here