Tweeted twitter.com/StackMma/status/1333425602498613249
added 950 characters in body
Source Link

I combine them to make a one table of points t = Thread[{x, y}]; Using that table I build graphic: enter image description here[![enter image description here][1]][1]
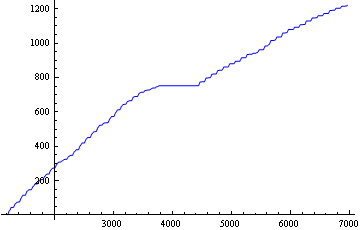
//----------------------------------- so since I don't see any way that interpolation will work, I decide work more on a way of approximation, but if you have a method that work with interpolation I would glad to see it. So here what I come to:

x = Import["C:\...\x.txt","List"];
x = Sort[x];
l = Length[x];
y = Array[1211 + # &, l];
t = Thread[{x, y}];
l = Fit[t, {1, v, v^2}, v]
l1 = LinearModelFit[t, v1, v1];
Show[ListPlot[t], Plot[l1[v1], {v1, 0, 7000}]]

And I have

[![enter image description here][2]][2]

it gave me a function that I looking for:

848.726+0.362082v-0.0000206136v^2

however i would like to build approximation function, that go through as many points as it can. So how can I do that? As What I ideally trying to make is two approximation functions for each half of the graph that go through as many points as it can. [1]: https://i.sstatic.net/AYJja.png [2]: https://i.sstatic.net/HpwUU.png

I combine them to make a one table of points t = Thread[{x, y}]; Using that table I build graphic: enter image description here

I combine them to make a one table of points t = Thread[{x, y}]; Using that table I build graphic: [![enter image description here][1]][1]

//----------------------------------- so since I don't see any way that interpolation will work, I decide work more on a way of approximation, but if you have a method that work with interpolation I would glad to see it. So here what I come to:

x = Import["C:\...\x.txt","List"];
x = Sort[x];
l = Length[x];
y = Array[1211 + # &, l];
t = Thread[{x, y}];
l = Fit[t, {1, v, v^2}, v]
l1 = LinearModelFit[t, v1, v1];
Show[ListPlot[t], Plot[l1[v1], {v1, 0, 7000}]]

And I have

[![enter image description here][2]][2]

it gave me a function that I looking for:

848.726+0.362082v-0.0000206136v^2

however i would like to build approximation function, that go through as many points as it can. So how can I do that? As What I ideally trying to make is two approximation functions for each half of the graph that go through as many points as it can. [1]: https://i.sstatic.net/AYJja.png [2]: https://i.sstatic.net/HpwUU.png

edited title
Link

Mathematica Interpolation or aproximationapproximation

added 363 characters in body
Source Link

I have lists of points X and Y.

{1212,1216,1217,1219...}, {1,2,3,4,5,6...}

I combine them to make a one table of points t = Thread[{x, y}]; Using that table I build graphic: enter image description here

So I need to find function/formula out of this table of point. So the best variant as I think is using InterpolatingFunction[range, table] and InterpolatingPolynomial[data, var]. But since we have huge amount of data the polynomial will be really huge (if I'm correct for n points, polynomial will be n-1). So if I understand correct it is not possible to use interpolation for it. Right? Therefore, we need to use regression to find approximated function, using Fit[t, func, v];. To make a better result, as I see, better divide graph in half, where it shifted to the right (near x = 4000). And make two approximation graph instead of one.

Since I'm not using Mathematica in daily use (it is my first time in this program), I need help.

What function is best to use in Fit[t, fun, v]? And how can I build two approximation functions for one graph? Do I need to divide the initial graph by my self?

Are there other methods that I missed?

Here is what I tried to do:

x = Import["C:\...\x.txt","List"];
x = Sort[x];
l = Length[x];
y = Array[0 + # &, l];
t = Thread[{x, y}]
funi = Interpolation[t];
InterpolatingFunction[{1, 200}, 0];
p = InterpolatingPolynomial[t, v]   //trying to get a function
{funi[1212]}       
ListLinePlot[{t}]  //graphic

I have lists of points X and Y.

{1212,1216,1217,1219...}, {1,2,3,4,5,6...}

I combine them to make a one table of points t = Thread[{x, y}]; Using that table I build graphic: enter image description here

So I need to find function/formula out of this table of point. So the best variant as I think is using InterpolatingFunction[range, table] and InterpolatingPolynomial[data, var]. But since we have huge amount of data the polynomial will be really huge (if I'm correct for n points, polynomial will be n-1). So if I understand correct it is not possible to use interpolation for it. Right? Therefore, we need to use regression to find approximated function, using Fit[t, func, v];. To make a better result, as I see, better divide graph in half, where it shifted to the right (near x = 4000). And make two approximation graph instead of one.

Since I'm not using Mathematica in daily use (it is my first time in this program), I need help.

What function is best to use in Fit[t, fun, v]? And how can I build two approximation functions for one graph? Do I need to divide the initial graph by my self?

Are there other methods that I missed?

Here is what I tried to do:

x = Import["C:\...\x.txt","List"];
x = Sort[x];
l = Length[x];
y = Array[0 + # &, l];
t = Thread[{x, y}]
funi = Interpolation[t];
InterpolatingFunction[{1, 200}, 0];
p = InterpolatingPolynomial[t, v]   //trying to get a function
{funi[1212]}       
ListLinePlot[{t}]  //graphic
code formatting
Source Link
Jagra
  • 14.6k
  • 1
  • 39
  • 82
Loading
Source Link
Loading