updated due to fix
Source Link
gwr
  • 13.6k
  • 2
  • 48
  • 82

Bug introduced in 10.4.0.0, probably introduced or earlier and fixed in 11.0.1.


Compare the two solution sets below: in the first one (x == False), there are only 3 dependent variables while in the second one (x == True), a dependent algebraic variable is introduced as r[t] == 5 (converting the ODE to a DAE). A DAE often requires a different NDSolve method, here I used "EquationSimplification" -> {Automatic, "SimplifySystem" -> True} which messes up the solution order as is apparent from the plots.

ClearAll[t, R, A, P, r, x];
eq = {
      R'[t] == -.1 R[t],
      A'[t] == .1 A[t],
      P'[t] == 0,
      If[x, r[t] == Sin[t], Nothing],
      R[0] == 1, A[0] == 1, P[0] == 1
  };

sol1 = Block[{x = False}, 
   NDSolve[eq, {R, A, P}, {t, 0, 20}, DependentVariables -> {R, A, P}]];
sol2 = Block[{x = True}, 
   NDSolve[eq, {R, A, P, r}, {t, 0, 20}, DependentVariables -> {R, A, P, r}, 
    Method -> {"EquationSimplification" -> {Automatic, 
        "SimplifySystem" -> True}}]];

Grid[{
   LogPlot[#[t] /. sol1, {t, 0, 20}, PlotLabel -> #] & /@ {R, A, P},
   LogPlot[#[t] /. sol2, {t, 0, 20}, PlotLabel -> #] & /@ {R, A, P, r}
}]
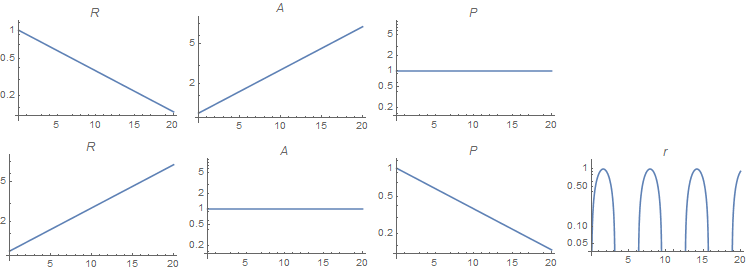
Mathematica graphics

Can anyone reproduce this bug?

(Mathematica 10.4.0.0, Windows 7, 64bits)


TechSupport filed an internal report acknowledging the wrong order of output.

Bug in 10.4.0.0, probably introduced earlier.


Compare the two solution sets below: in the first one (x == False), there are only 3 dependent variables while in the second one (x == True), a dependent algebraic variable is introduced as r[t] == 5 (converting the ODE to a DAE). A DAE often requires a different NDSolve method, here I used "EquationSimplification" -> {Automatic, "SimplifySystem" -> True} which messes up the solution order as is apparent from the plots.

ClearAll[t, R, A, P, r, x];
eq = {
      R'[t] == -.1 R[t],
      A'[t] == .1 A[t],
      P'[t] == 0,
      If[x, r[t] == Sin[t], Nothing],
      R[0] == 1, A[0] == 1, P[0] == 1
  };

sol1 = Block[{x = False}, 
   NDSolve[eq, {R, A, P}, {t, 0, 20}, DependentVariables -> {R, A, P}]];
sol2 = Block[{x = True}, 
   NDSolve[eq, {R, A, P, r}, {t, 0, 20}, DependentVariables -> {R, A, P, r}, 
    Method -> {"EquationSimplification" -> {Automatic, 
        "SimplifySystem" -> True}}]];

Grid[{
   LogPlot[#[t] /. sol1, {t, 0, 20}, PlotLabel -> #] & /@ {R, A, P},
   LogPlot[#[t] /. sol2, {t, 0, 20}, PlotLabel -> #] & /@ {R, A, P, r}
}]

Mathematica graphics

Can anyone reproduce this bug?

(Mathematica 10.4.0.0, Windows 7, 64bits)


TechSupport filed an internal report acknowledging the wrong order of output.

Bug introduced in 10.4.0.0 or earlier and fixed in 11.0.1.


Compare the two solution sets below: in the first one (x == False), there are only 3 dependent variables while in the second one (x == True), a dependent algebraic variable is introduced as r[t] == 5 (converting the ODE to a DAE). A DAE often requires a different NDSolve method, here I used "EquationSimplification" -> {Automatic, "SimplifySystem" -> True} which messes up the solution order as is apparent from the plots.

ClearAll[t, R, A, P, r, x];
eq = {
      R'[t] == -.1 R[t],
      A'[t] == .1 A[t],
      P'[t] == 0,
      If[x, r[t] == Sin[t], Nothing],
      R[0] == 1, A[0] == 1, P[0] == 1
  };

sol1 = Block[{x = False}, 
   NDSolve[eq, {R, A, P}, {t, 0, 20}, DependentVariables -> {R, A, P}]];
sol2 = Block[{x = True}, 
   NDSolve[eq, {R, A, P, r}, {t, 0, 20}, DependentVariables -> {R, A, P, r}, 
    Method -> {"EquationSimplification" -> {Automatic, 
        "SimplifySystem" -> True}}]];

Grid[{
   LogPlot[#[t] /. sol1, {t, 0, 20}, PlotLabel -> #] & /@ {R, A, P},
   LogPlot[#[t] /. sol2, {t, 0, 20}, PlotLabel -> #] & /@ {R, A, P, r}
}]

Mathematica graphics

Can anyone reproduce this bug?

(Mathematica 10.4.0.0, Windows 7, 64bits)


TechSupport filed an internal report acknowledging the wrong order of output.

added 165 characters in body; edited tags
Source Link
István Zachar
  • 47.2k
  • 20
  • 145
  • 293

Bug in 10.4.0.0, probably introduced earlier.


Compare the two solution sets below: in the first one (x == False), there are only 3 dependent variables while in the second one (x == True), a dependent algebraic variable is introduced as r[t] == 5 (converting the ODE to a DAE). A DAE often requires a different NDSolve method, here I used "EquationSimplification" -> {Automatic, "SimplifySystem" -> True} which messes up the solution order as is apparent from the plots.

ClearAll[t, R, A, P, r, x];
eq = {
      R'[t] == -.1 R[t],
      A'[t] == .1 A[t],
      P'[t] == 0,
      If[x, r[t] == Sin[t], Nothing],
      R[0] == 1, A[0] == 1, P[0] == 1
  };

sol1 = Block[{x = False}, 
   NDSolve[eq, {R, A, P}, {t, 0, 20}, DependentVariables -> {R, A, P}]];
sol2 = Block[{x = True}, 
   NDSolve[eq, {R, A, P, r}, {t, 0, 20}, DependentVariables -> {R, A, P, r}, 
    Method -> {"EquationSimplification" -> {Automatic, 
        "SimplifySystem" -> True}}]];

Grid[{
   LogPlot[#[t] /. sol1, {t, 0, 20}, PlotLabel -> #] & /@ {R, A, P},
   LogPlot[#[t] /. sol2, {t, 0, 20}, PlotLabel -> #] & /@ {R, A, P, r}
}]

Mathematica graphics

Can anyone reproduce this bug?

(Mathematica 10.4.0.0, Windows 7, 64bits)


TechSupport filed an internal report acknowledging the wrong order of output.

Compare the two solution sets below: in the first one (x == False), there are only 3 dependent variables while in the second one (x == True), a dependent algebraic variable is introduced as r[t] == 5 (converting the ODE to a DAE). A DAE often requires a different NDSolve method, here I used "EquationSimplification" -> {Automatic, "SimplifySystem" -> True} which messes up the solution order as is apparent from the plots.

ClearAll[t, R, A, P, r, x];
eq = {
      R'[t] == -.1 R[t],
      A'[t] == .1 A[t],
      P'[t] == 0,
      If[x, r[t] == Sin[t], Nothing],
      R[0] == 1, A[0] == 1, P[0] == 1
  };

sol1 = Block[{x = False}, 
   NDSolve[eq, {R, A, P}, {t, 0, 20}, DependentVariables -> {R, A, P}]];
sol2 = Block[{x = True}, 
   NDSolve[eq, {R, A, P, r}, {t, 0, 20}, DependentVariables -> {R, A, P, r}, 
    Method -> {"EquationSimplification" -> {Automatic, 
        "SimplifySystem" -> True}}]];

Grid[{
   LogPlot[#[t] /. sol1, {t, 0, 20}, PlotLabel -> #] & /@ {R, A, P},
   LogPlot[#[t] /. sol2, {t, 0, 20}, PlotLabel -> #] & /@ {R, A, P, r}
}]

Mathematica graphics

Can anyone reproduce this bug?

(Mathematica 10.4.0.0, Windows 7, 64bits)

Bug in 10.4.0.0, probably introduced earlier.


Compare the two solution sets below: in the first one (x == False), there are only 3 dependent variables while in the second one (x == True), a dependent algebraic variable is introduced as r[t] == 5 (converting the ODE to a DAE). A DAE often requires a different NDSolve method, here I used "EquationSimplification" -> {Automatic, "SimplifySystem" -> True} which messes up the solution order as is apparent from the plots.

ClearAll[t, R, A, P, r, x];
eq = {
      R'[t] == -.1 R[t],
      A'[t] == .1 A[t],
      P'[t] == 0,
      If[x, r[t] == Sin[t], Nothing],
      R[0] == 1, A[0] == 1, P[0] == 1
  };

sol1 = Block[{x = False}, 
   NDSolve[eq, {R, A, P}, {t, 0, 20}, DependentVariables -> {R, A, P}]];
sol2 = Block[{x = True}, 
   NDSolve[eq, {R, A, P, r}, {t, 0, 20}, DependentVariables -> {R, A, P, r}, 
    Method -> {"EquationSimplification" -> {Automatic, 
        "SimplifySystem" -> True}}]];

Grid[{
   LogPlot[#[t] /. sol1, {t, 0, 20}, PlotLabel -> #] & /@ {R, A, P},
   LogPlot[#[t] /. sol2, {t, 0, 20}, PlotLabel -> #] & /@ {R, A, P, r}
}]

Mathematica graphics

Can anyone reproduce this bug?

(Mathematica 10.4.0.0, Windows 7, 64bits)


TechSupport filed an internal report acknowledging the wrong order of output.

added tag options
Link
gwr
  • 13.6k
  • 2
  • 48
  • 82
deleted 45 characters in body
Source Link
István Zachar
  • 47.2k
  • 20
  • 145
  • 293
Loading
deleted 4 characters in body
Source Link
István Zachar
  • 47.2k
  • 20
  • 145
  • 293
Loading
added 5 characters in body
Source Link
István Zachar
  • 47.2k
  • 20
  • 145
  • 293
Loading
deleted 111 characters in body
Source Link
István Zachar
  • 47.2k
  • 20
  • 145
  • 293
Loading
Source Link
István Zachar
  • 47.2k
  • 20
  • 145
  • 293
Loading