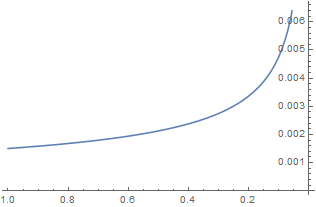
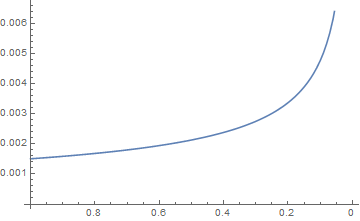
There is a way with ListPlot. You can always generate a list with your function and use with ListPlot or ListLinePlot.
F[x_] := 0.00150614 Sqrt[1/x]
xmin = 0.01; xmax = 1.0;
data = {#, F[#]} & /@ Range[0.01Range[xmin, 1xmax, 0.01];
ListLinePlot[data, ScalingFunctions -> {"Reverse", Identity}, AxesOrigin -> {xmax, 0}]


