I have the following points:
aa={{238.5, 394.5}, {195.5, 441.5}, {219.5, 397.5}, {216.5,
 398.5}, {246.5, 397.5}, {265.5, 476.5}, {275.5, 450.5}, {273.5,
 435.5}, {274.5, 461.5}, {212.5, 447.5}, {221.5, 457.5}}
Now, I want to draw a closed curve from those line. So I used the following code:
Graphics[{{Blue, Point[aa]}, JoinedCurve[Line[aa], CurveClosed -> True]}]
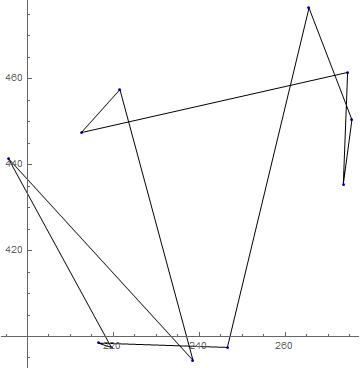
But, it gives me curve like this:
[![enter image description here][1]][1]
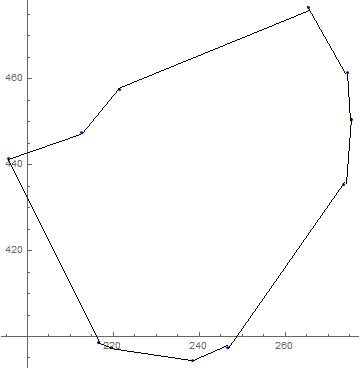
I want the curve like this way:
[![enter image description here][2]][2]
Please let me know, how to do it. And, I want it to do automatically, not point by point. Please let me know. Thanks. [1]: https://i.sstatic.net/voq3z.jpg [2]: https://i.sstatic.net/ZGmkp.jpg
