added 460 characters in body
Source Link
rhermans
  • 37.4k
  • 4
  • 61
  • 152
Plot[
 Sin[x]/x
 , {x, -2 π, 2 π}
 , Filling -> {1 -> {Axis, {Transparent, Automatic}}}
 , AxesLabel -> {"Distance from Slit", "Amplitude"}
 , PlotLabel -> "Single Slit Difraction"
 ]
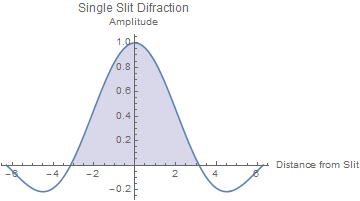
Mathematica graphics

OR

Plot[
 Sin[x]/x
 , {x, -2 π, 2 π}
 , Filling -> Axis
 , FillingStyle -> {Transparent, LightBlue}
 , AxesLabel -> {"Distance from Slit", "Amplitude"}
 , PlotLabel -> "Single Slit Difraction"
 ]
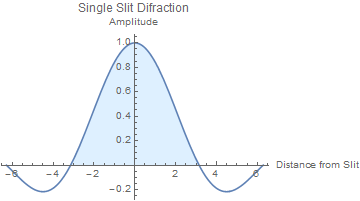
Mathematica graphics

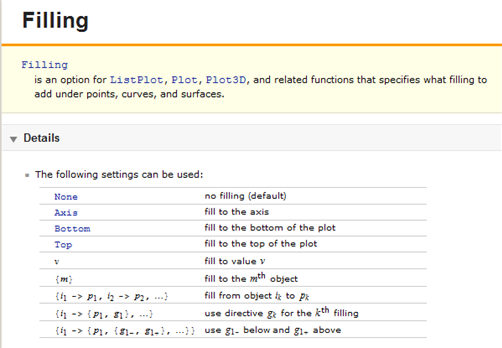
Documentation for Filling

Mathematica graphics

Plot[
 Sin[x]/x
 , {x, -2 π, 2 π}
 , Filling -> {1 -> {Axis, {Transparent, Automatic}}}
 , AxesLabel -> {"Distance from Slit", "Amplitude"}
 , PlotLabel -> "Single Slit Difraction"
 ]

Mathematica graphics

Plot[
 Sin[x]/x
 , {x, -2 π, 2 π}
 , Filling -> {1 -> {Axis, {Transparent, Automatic}}}
 , AxesLabel -> {"Distance from Slit", "Amplitude"}
 , PlotLabel -> "Single Slit Difraction"
 ]

Mathematica graphics

OR

Plot[
 Sin[x]/x
 , {x, -2 π, 2 π}
 , Filling -> Axis
 , FillingStyle -> {Transparent, LightBlue}
 , AxesLabel -> {"Distance from Slit", "Amplitude"}
 , PlotLabel -> "Single Slit Difraction"
 ]

Mathematica graphics

Documentation for Filling

Mathematica graphics

Source Link
rhermans
  • 37.4k
  • 4
  • 61
  • 152

Plot[
 Sin[x]/x
 , {x, -2 π, 2 π}
 , Filling -> {1 -> {Axis, {Transparent, Automatic}}}
 , AxesLabel -> {"Distance from Slit", "Amplitude"}
 , PlotLabel -> "Single Slit Difraction"
 ]

Mathematica graphics