edited title
Link
m_goldberg
  • 108.1k
  • 16
  • 104
  • 259

How to changedemonstrate a hand calculated demonstrationlimit without having to pre-calculate certain points

Improved formatting
Source Link
m_goldberg
  • 108.1k
  • 16
  • 104
  • 259
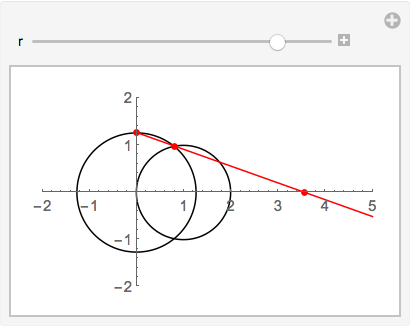
  1. You have a circle of radius r centered at the origin.

  2. You have a circle of radius 1 centered at (1,0).

  3. You draw a ray through the point (0,r) and the point where the circles intersect.

  4. Let R be the point where the ray intersects the x-axis.

  5. The question is, what happens to the point R as $r\to 0$.

I have:

Manipulate[
  Graphics[{
    Circle[{1, 0}, 1],
    Circle[{0, 0}, r],
    Red, PointSize[Medium],
    Point[{0, r}],
    Point[{r^2/2, Sqrt[1 - (r^2/2 - 1)^2]}],
    Point[{2 + Sqrt[4 - r^2], 0}],
    HalfLine[{{0, r}, {r^2/2, Sqrt[1 - (r^2/2 - 1)^2]}}]
   },
    Axes -> True,
    PlotRange -> {{-2, 5}, {-2, 2}}], 
  {{r, 1.4}, 0, 1.5}]

Which produces this image.

enter image description here

Now, I did a bunch of math, similar triangles, etc., to find that the coordinates of the point of intersection is $(r^2/2,\sqrt{1-(r^2/2-1)^2}$ and the point R, where the ray intersects the x-axis, is $2+\sqrt{4-r^2}$.

I'm just wondering how folks might do this same thing without making those math calculations.

  1. You have a circle of radius r centered at the origin.

  2. You have a circle of radius 1 centered at (1,0).

  3. You draw a ray through the point (0,r) and the point where the circles intersect.

  4. Let R be the point where the ray intersects the x-axis.

  5. The question is, what happens to the point R as $r\to 0$.

I have:

Manipulate[
 Graphics[{
   Circle[{1, 0}, 1],
   Circle[{0, 0}, r],
   Red, PointSize[Medium],
   Point[{0, r}],
   Point[{r^2/2, Sqrt[1 - (r^2/2 - 1)^2]}],
   Point[{2 + Sqrt[4 - r^2], 0}],
   HalfLine[{{0, r}, {r^2/2, Sqrt[1 - (r^2/2 - 1)^2]}}]
   },
  Axes -> True,
  PlotRange -> {{-2, 5}, {-2, 2}}], {{r, 1.4}, 0, 1.5}]

Which produces this image.

enter image description here

Now, I did a bunch of math, similar triangles, etc., to find that the coordinates of the point of intersection is $(r^2/2,\sqrt{1-(r^2/2-1)^2}$ and the point R, where the ray intersects the x-axis, is $2+\sqrt{4-r^2}$.

I'm just wondering how folks might do this same thing without making those math calculations.
  1. You have a circle of radius r centered at the origin.

  2. You have a circle of radius 1 centered at (1,0).

  3. You draw a ray through the point (0,r) and the point where the circles intersect.

  4. Let R be the point where the ray intersects the x-axis.

  5. The question is, what happens to the point R as $r\to 0$.

I have:

Manipulate[
  Graphics[{
    Circle[{1, 0}, 1],
    Circle[{0, 0}, r],
    Red, PointSize[Medium],
    Point[{0, r}],
    Point[{r^2/2, Sqrt[1 - (r^2/2 - 1)^2]}],
    Point[{2 + Sqrt[4 - r^2], 0}],
    HalfLine[{{0, r}, {r^2/2, Sqrt[1 - (r^2/2 - 1)^2]}}]},
    Axes -> True,
    PlotRange -> {{-2, 5}, {-2, 2}}], 
  {{r, 1.4}, 0, 1.5}]

Which produces this image.

enter image description here

Now, I did a bunch of math, similar triangles, etc., to find that the coordinates of the point of intersection is $(r^2/2,\sqrt{1-(r^2/2-1)^2}$ and the point R, where the ray intersects the x-axis, is $2+\sqrt{4-r^2}$.

I'm just wondering how folks might do this same thing without making those math calculations.

Source Link
David
  • 15k
  • 4
  • 47
  • 121

How to change a hand calculated demonstration

  1. You have a circle of radius r centered at the origin.

  2. You have a circle of radius 1 centered at (1,0).

  3. You draw a ray through the point (0,r) and the point where the circles intersect.

  4. Let R be the point where the ray intersects the x-axis.

  5. The question is, what happens to the point R as $r\to 0$.

I have:

Manipulate[
 Graphics[{
   Circle[{1, 0}, 1],
   Circle[{0, 0}, r],
   Red, PointSize[Medium],
   Point[{0, r}],
   Point[{r^2/2, Sqrt[1 - (r^2/2 - 1)^2]}],
   Point[{2 + Sqrt[4 - r^2], 0}],
   HalfLine[{{0, r}, {r^2/2, Sqrt[1 - (r^2/2 - 1)^2]}}]
   },
  Axes -> True,
  PlotRange -> {{-2, 5}, {-2, 2}}], {{r, 1.4}, 0, 1.5}]

Which produces this image.

enter image description here

Now, I did a bunch of math, similar triangles, etc., to find that the coordinates of the point of intersection is $(r^2/2,\sqrt{1-(r^2/2-1)^2}$ and the point R, where the ray intersects the x-axis, is $2+\sqrt{4-r^2}$.

I'm just wondering how folks might do this same thing without making those math calculations.