replaced http://mathematica.stackexchange.com/ with https://mathematica.stackexchange.com/
Source Link

I have several 2D figures, and now I want to map them into the 3D space plane, the picture below shows my idea.

enter image description here

The figure above was made by maping texture of the 2D plot on the 3D plane and the idea is from Placing a ContourPlot under a Plot3DPlacing a ContourPlot under a Plot3D

However I think the figure made in this way is not in the good quality and time-consuming, I also note the second idea mentioned in the above link, which extracts graphics primitives from the figures and make them 3D graphics primitives, as in the case discussed here, the picture consists of two different ListContourPlot, suppose they are fig1 and fig2 respectively. I want to use Append to add a zero in the fig2's coordinates and then use the idea provided in How to plot ternary density plots?How to plot ternary density plots? Michael 2E's answer , I want to find the transformation firstly and then use the GeometricTransformation function to map the 2D figure on the 3D plane, However I meet several mistakes. For example, first I use the Append to add a zero to make the 2D figure's coordinates become 3D.

pts=Append[#,0]&/@fig2[[1,1]];

and then let the coordinate of the fig2 equal to pts

fig2[[1,1]]=pts;

Some mistake occured here. The coordinates of the fig1 become 4-Dimensions, and this is strange to me as I only add one zero after the coordinates, and I don't know how to solve it.

So could you give me some advices to me on this problem ? Besides, the figures I got are plot respectively and they are not consistent in the color,(i.e., even the points in the fig1 and fig2 have the same value, they have different color), could you give me some advice on how to make the color in the different figure consistent ?

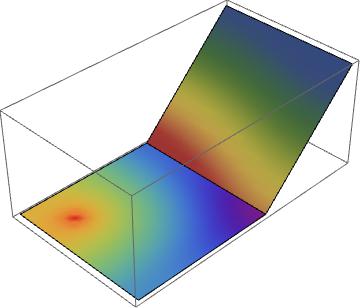
I have several 2D figures, and now I want to map them into the 3D space plane, the picture below shows my idea.

enter image description here

The figure above was made by maping texture of the 2D plot on the 3D plane and the idea is from Placing a ContourPlot under a Plot3D

However I think the figure made in this way is not in the good quality and time-consuming, I also note the second idea mentioned in the above link, which extracts graphics primitives from the figures and make them 3D graphics primitives, as in the case discussed here, the picture consists of two different ListContourPlot, suppose they are fig1 and fig2 respectively. I want to use Append to add a zero in the fig2's coordinates and then use the idea provided in How to plot ternary density plots? Michael 2E's answer , I want to find the transformation firstly and then use the GeometricTransformation function to map the 2D figure on the 3D plane, However I meet several mistakes. For example, first I use the Append to add a zero to make the 2D figure's coordinates become 3D.

pts=Append[#,0]&/@fig2[[1,1]];

and then let the coordinate of the fig2 equal to pts

fig2[[1,1]]=pts;

Some mistake occured here. The coordinates of the fig1 become 4-Dimensions, and this is strange to me as I only add one zero after the coordinates, and I don't know how to solve it.

So could you give me some advices to me on this problem ? Besides, the figures I got are plot respectively and they are not consistent in the color,(i.e., even the points in the fig1 and fig2 have the same value, they have different color), could you give me some advice on how to make the color in the different figure consistent ?

edited tags
Link
Source Link
Ice0cean
  • 813
  • 4
  • 11

How to map a 2D figure into the 3D plane?

I have several 2D figures, and now I want to map them into the 3D space plane, the picture below shows my idea.

enter image description here

The figure above was made by maping texture of the 2D plot on the 3D plane and the idea is from Placing a ContourPlot under a Plot3D

However I think the figure made in this way is not in the good quality and time-consuming, I also note the second idea mentioned in the above link, which extracts graphics primitives from the figures and make them 3D graphics primitives, as in the case discussed here, the picture consists of two different ListContourPlot, suppose they are fig1 and fig2 respectively. I want to use Append to add a zero in the fig2's coordinates and then use the idea provided in How to plot ternary density plots? Michael 2E's answer , I want to find the transformation firstly and then use the GeometricTransformation function to map the 2D figure on the 3D plane, However I meet several mistakes. For example, first I use the Append to add a zero to make the 2D figure's coordinates become 3D.

pts=Append[#,0]&/@fig2[[1,1]];

and then let the coordinate of the fig2 equal to pts

fig2[[1,1]]=pts;

Some mistake occured here. The coordinates of the fig1 become 4-Dimensions, and this is strange to me as I only add one zero after the coordinates, and I don't know how to solve it.

So could you give me some advices to me on this problem ? Besides, the figures I got are plot respectively and they are not consistent in the color,(i.e., even the points in the fig1 and fig2 have the same value, they have different color), could you give me some advice on how to make the color in the different figure consistent ?