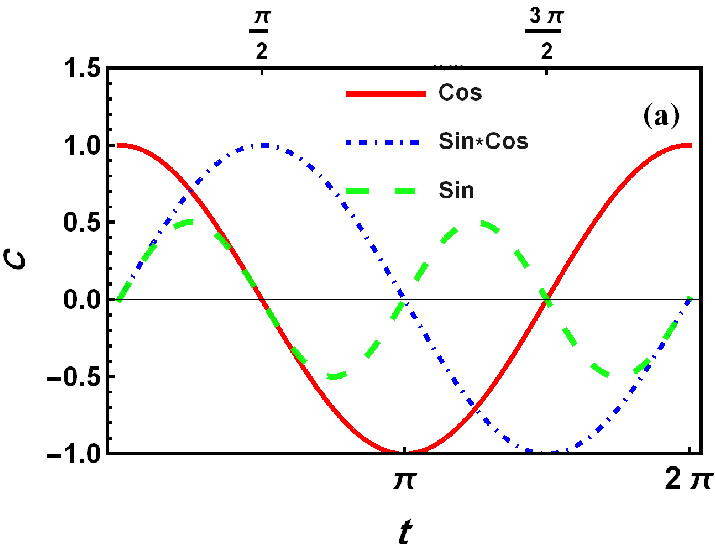
I have used of these lines to plot three functions (in the first plotted figure) and I used of PlotLegend for them to be recognized.
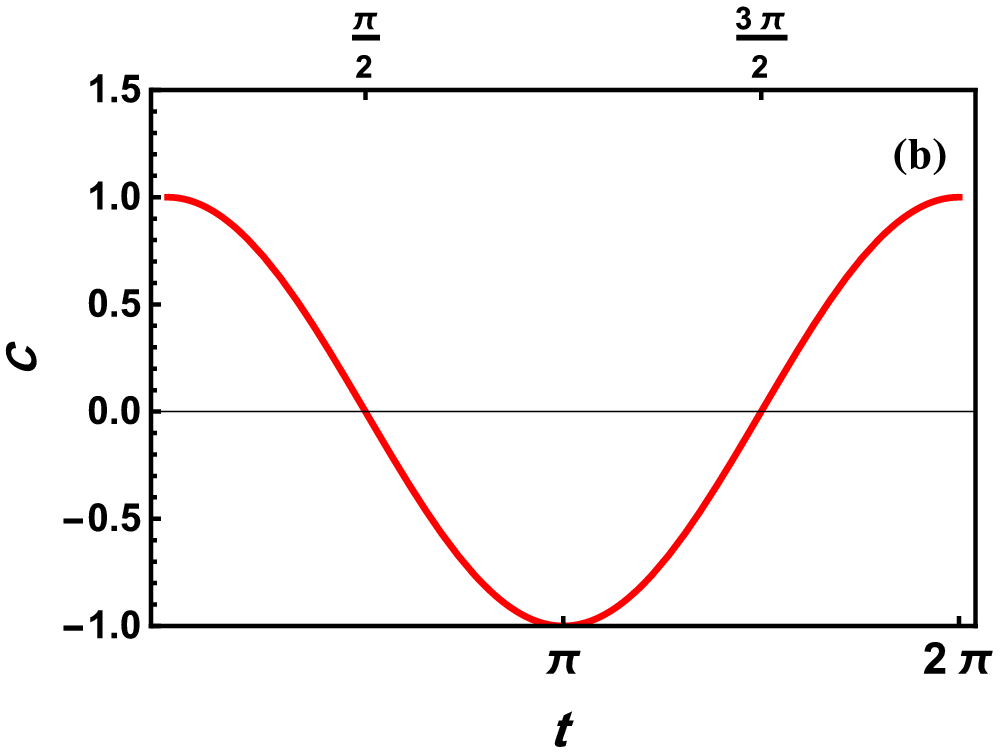
In the second plot I have used of all written for the first plot except what written for PlotLegend.
For the first:
ttick = {\[Pi], 2 \[Pi]};
tstick = {\[Pi]/2, 3 \[Pi]/2};


plot123 = Plot[{Cos[t], Sin[t], Sin[t]*Cos[t]}, {t, 0, 2 \[Pi]},
PlotStyle -> {{Red, Thickness[0.008]}, {Blue, Thickness[0.008],
 DotDashed}, {Green, Opacity[0.9], Thickness[0.01],
 Dashing[Large]}}, Frame -> True,
 FrameStyle -> {{{Thickness[0.0054], 14,
  Bold}, {Directive[Thickness[0.005]], 14,
  Bold}}, {{Thickness[0.0055], 16, Bold}, {Thickness[0.005], 16,
  Bold}}},
 FrameLabel -> {Style[t, Bold, Black, 18],
 Style[C, Bold, Black, 15]},
 FrameTicks -> { {Automatic, None}, {ttick, tstick}},
 Epilog -> Inset[Text[Style["(a)", 16, Bold]], {2 \[Pi] - 0.3, 1.2}],
 PlotRange -> {All, {-1, 1.5}}, AspectRatio -> 0.65,
 ImageSize -> 360,
 PlotLegends ->
 Placed[LineLegend[{"Cos", "Sin*Cos", "Sin"},
 LabelStyle -> {GrayLevel[0.1], Bold, 12},
 LegendLayout -> {"Row", 3}], {0.56, 0.85}]]

 Export["plot123.eps", plot123, ImageResolution -> 360]
For the second:
plot1 = Plot[Cos[t], {t, 0, 2 \[Pi]},
PlotStyle -> {Red, Thickness[0.008]}, Frame -> True,
 FrameStyle -> {{{Thickness[0.0054], 14,
  Bold}, {Directive[Thickness[0.005]], 14,
  Bold}}, {{Thickness[0.0055], 16, Bold}, {Thickness[0.005], 16,
  Bold}}},
 FrameLabel -> {Style[t, Bold, Black, 18],
Style[C, Bold, Black, 15]},
 FrameTicks -> { {Automatic, None}, {ttick, tstick}},
 Epilog -> Inset[Text[Style["(b)", 16, Bold]], {2 \[Pi] - 0.3, 1.2}],
 PlotRange -> {All, {-1, 1.5}}, AspectRatio -> 0.65,
 ImageSize -> 360]

 Export["plot1.eps", plot1, ImageResolution -> 360]
As it is clear, the quality of the first plot is too less than the second one. FrameTicks, plot colors and other things in the first is not as good as the second. How can I have a good plot although I use of plotlegend?!


