33
$\begingroup$

The Circle function is strictly a 2D Graphics object, so that we cannot directly combine a Circle with a Graphics3D object such as a sphere:

 Show[{ Graphics3D[Sphere[] , Circle[]] }]  

(* Circle is not a Graphics3D primitive or directive *)

How can I draw circle in 3D?

For example consider a unit Sphere[] centered at the origin. How can we draw a circle passing through a specified point with the circle center along a vector passing through a second point.

$\endgroup$
12
  • $\begingroup$ Did you try something ? Like reading in the documentation about Graphics ? $\endgroup$
    – Sektor
    Commented Apr 10, 2015 at 19:51
  • 4
    $\begingroup$ @kuba @sektor Now now. Using the undocumented function Read@Mind[{}] is not for everyone. Isn't there a badge for achieving the Beginner's Mind? $\endgroup$ Commented Apr 11, 2015 at 1:22
  • 1
    $\begingroup$ If the center of the circle lies on the sphere it is impossible that the circle itself lies on the sphere. $\endgroup$ Commented Apr 11, 2015 at 15:25
  • 1
    $\begingroup$ I hope its ok, I took the liberty of improving the question because there are a number of good answers here..and the question appears in danger of being closed. $\endgroup$
    – george2079
    Commented Apr 13, 2015 at 15:02
  • 2
    $\begingroup$ Possible duplicates: mathematica.stackexchange.com/q/6526, mathematica.stackexchange.com/q/10957 $\endgroup$
    – Michael E2
    Commented Apr 27, 2015 at 12:32

7 Answers 7

64
$\begingroup$

Circle

Let's create circle3D that is something you would expect from Circle but with an extra argument for its normal vector.

With

circle3D[centre_: {0, 0, 0}, radius_: 1, normal_: {0, 0, 1}, angle_: {0, 2 Pi}] :=
  Composition[
    Line,
    Map[RotationTransform[{{0, 0, 1}, normal}, centre], #] &,
    Map[Append[#, Last@centre] &, #] &,
    Append[DeleteDuplicates[Most@#], Last@#] &,
    Level[#, {-2}] &,
    MeshPrimitives[#, 1] &,
    DiscretizeRegion,
    If
  ][
    First@Differences@angle >= 2 Pi,
    Circle[Most@centre, radius],
    Circle[Most@centre, radius, angle]
  ]

we can produce, for example, the following.

A unit circle centred at the origin with the z-axis as its normal:

Graphics3D[circle3D[]]
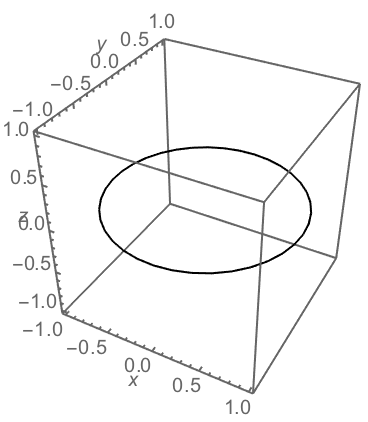
3D circle

A unit circle centred at {2, 3, 4} with the z-axis as its normal:

Graphics3D[circle3D[{2, 3, 4}, 2]]
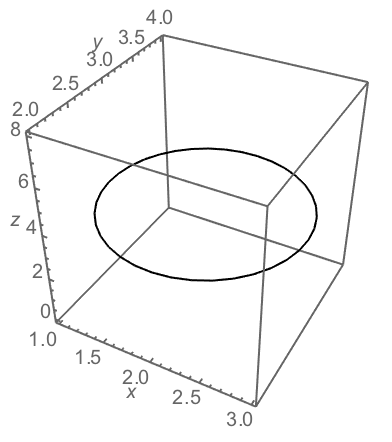
3D circle

A circle centred at {2, 3, 4} with radius 2 and the z-axis as its normal:

Graphics3D[circle3D[{2, 3, 4}, 2]]
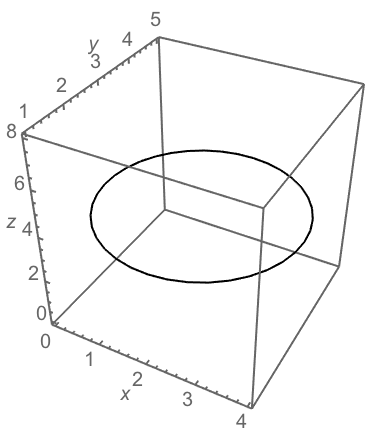
3D circle

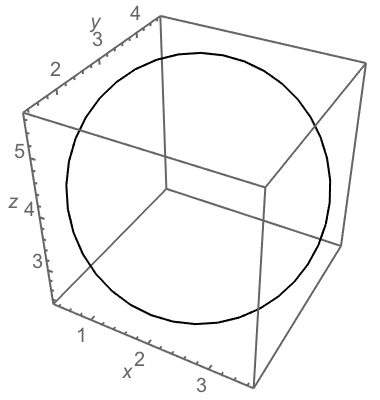
A circle centred at {2, 3, 4} with radius 2 and normal vector pointing in the direction of $\hat\imath - \hat\jmath + \hat{k}$:

Graphics3D[circle3D[{2, 3, 4}, 2, {1, -1, 1}]]
3D circle

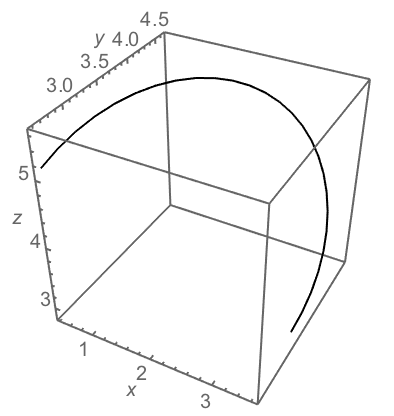
An arc, drawn from 0 to 180 degrees, of a circle whose origin is centred at {2, 3, 4}, radius is 2, and normal vector points in the direction of $\hat\imath - \hat\jmath + \hat{k}$:

Graphics3D[circle3D[{2, 3, 4}, 2, {1, -1, 1}, {0, 180 Degree}]]
3D circle

Neat Examples

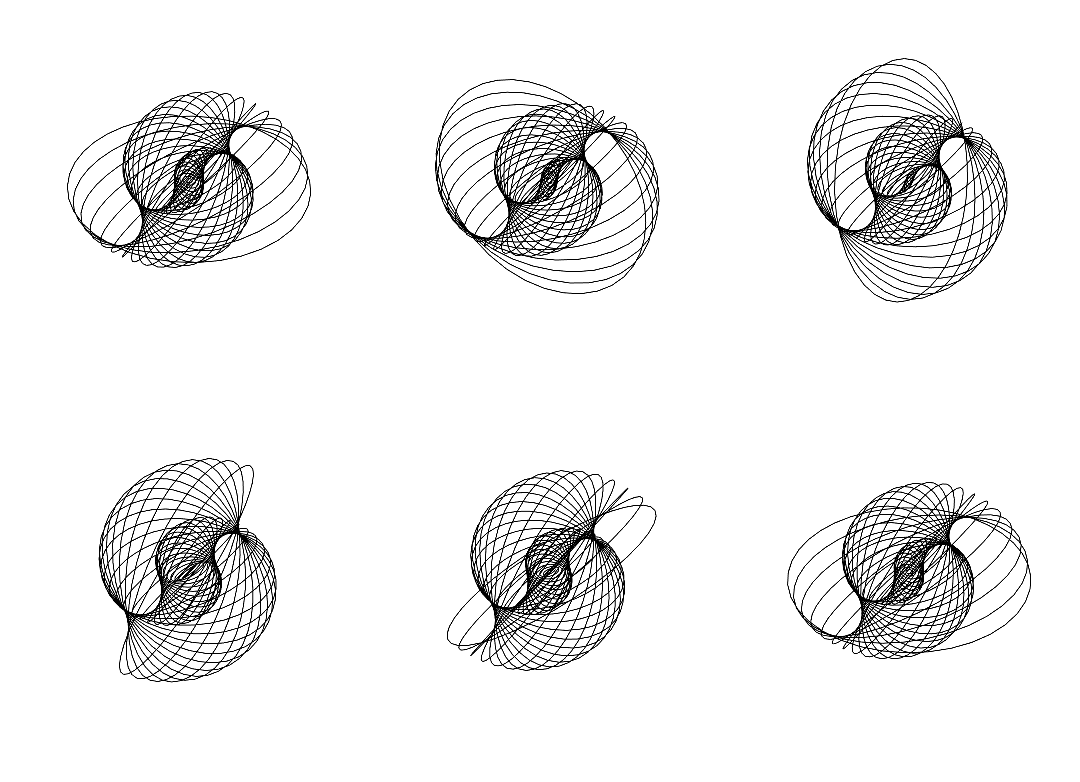
tocartesian = CoordinateTransformData["Spherical" -> "Cartesian", "Mapping"];
circles = MapThread[
  circle3D[{0, 0, 0}, #1, tocartesian[{#1, #2, 0}]] &,
  {Range[37], Range[0 Degree, 360 Degree, 10 Degree]}
];
ListAnimate@Table[
  Graphics3D[
    Rotate[#, n Degree, {0, 1, 0}] & /@ circles,
    Boxed -> False,
    PlotRange -> 37 {{-1, 1}, {-1, 1}, {-1, 1}}
  ],
  {n, 180}
]
3D circles

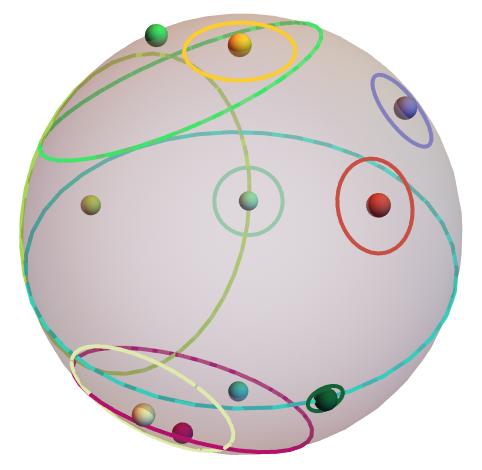
tocartesian = CoordinateTransformData["Spherical" -> "Cartesian", "Mapping"];
spherecentre = RandomReal[{-1, 1}, 3];
sphereradius = RandomReal[{1, 2}];
dotsize = sphereradius/20;
randcirc := Module[
  {circleradius, randompoint},
  circleradius = RandomReal[{dotsize, sphereradius}];
  randompoint = TranslationTransform[spherecentre][
    tocartesian[{sphereradius, RandomReal[{0, Pi}], 
    RandomReal[{0, 2 Pi}]}]
  ];
  {
    RandomColor[],
    Sphere[randompoint, dotsize],
    circle3D[
      spherecentre +
        Sqrt[sphereradius^2 - circleradius^2] Normalize[randompoint - spherecentre],
      circleradius,
      randompoint - spherecentre
    ]
  }
];
Graphics3D[
  {
    {Opacity[0.3, LightGray], Sphere[spherecentre, sphereradius]},
    Thick,
    Table[randcirc, {10}]
  },
  Boxed -> False
]
3D circles

Extras

Disk

Likewise, we can construct disk3D that behaves like Disk but with an extra argument for its normal vector.

disk3D[centre_: {0, 0, 0}, radius_: 1, normal_: {0, 0, 1}, angle_: {0, 2 Pi}] :=
  Polygon[
    Map[RotationTransform[{{0, 0, 1}, normal}, centre]][
      If[First@Differences@angle >= 2 Pi, #, Append[#, centre]] &[
        Map[Append[#, Last@centre] &][
          SortBy[#, sortf[#, Most@centre] &] &[
            MeshCoordinates[DiscretizeRegion[
              Circle[Most@centre, radius, angle]
]]]]]]]
sortf := Composition[
    If[Negative[#], # + 2 Pi, #] &,
    N[ArcTan @@ (#1 - #2)] &
]

The sorting of points is adapted from nikie's answer in #48091

Examples:

Graphics3D[disk3D[]]
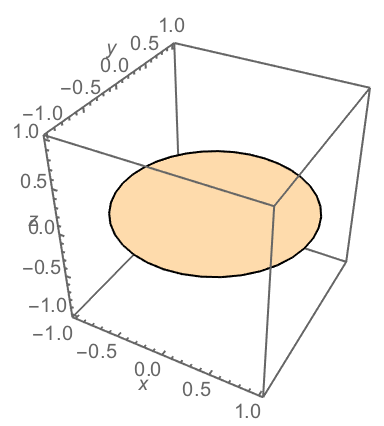
3D disk

Graphics3D[disk3D[{2, 3, 4}, 2, {1, -1, 1}, {30 Degree, 180 Degree}]]
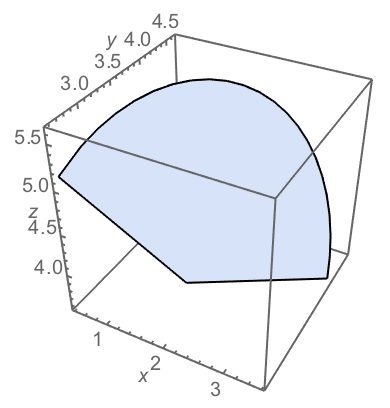
3D disk

It's a Polygon after all, so it behaves just like any other region object in Mathematica. You can execute, for example,

RegionMeasure[disk3D[{2, 3, 4}, 2, {1, -1, 1}, {30 Degree, 180 Degree}]]

and get the area:

5.2232

or style it like

disk = disk3D[{2, 3, 4}, 2, {1, -1, 1}, {30 Degree, 180 Degree}];
Graphics3D[{EdgeForm[], Red, disk}]
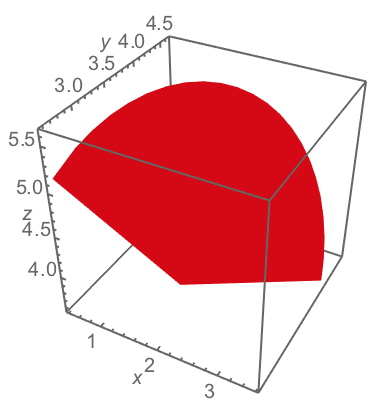
red 3D disk

Ellipse

After circle3D, why not ellipse3D as well?

ellipse3D[centre_: {0, 0, 0}, radii_: {1, 1}, normal_: {0, 0, 1}] := 
  Polygon[
    RotationTransform[{{0, 0, 1}, normal}, centre][
      Map[Append[#, Last@centre] &][
        SortBy[#, N[ArcTan @@ (# - Most@centre)] &] &[
          MeshCoordinates[BoundaryDiscretizeRegion[
            Ellipsoid[Most@centre, radii]
]]]]]]

Graphics3D[ellipse3D[]] is equivalent to Graphics3D[circle3D[]]:
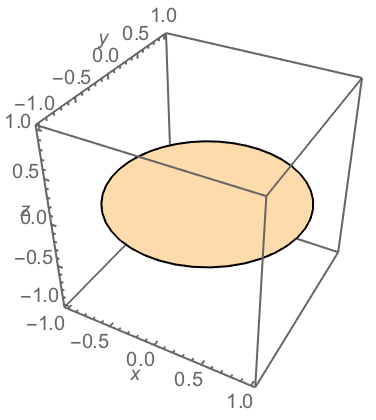
3D ellipse

Graphics3D[ellipse3D[{2, 3, 4}, {1, 2}, {1, -1, 1}]]
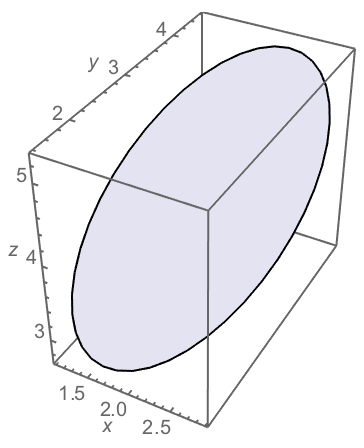
3D ellipse

RegionMeasure[ellipse3D[{2, 3, 4}, {1, 2}, {1, -1, 1}]]

6.25978

which is a little bit off from that of the same ellipse in 2D:

RegionMeasure[Ellipsoid[{2, 3}, {1, 2}]]

due to the discretisation.

$\endgroup$
6
  • $\begingroup$ Graphics3D[disk3D[{2,3,4},2,{1,-1,1},{90 Degree,270 Degree}]]has problem. $\endgroup$
    – kittygirl
    Commented Mar 17, 2018 at 15:25
  • $\begingroup$ @kittygirl Hmmmm I've got to change the SortBy Line somehow... $\endgroup$
    – Taiki
    Commented Jun 2, 2018 at 11:04
  • $\begingroup$ @kittygirl disk3D updated and tested. $\endgroup$
    – Taiki
    Commented Jun 4, 2018 at 14:17
  • $\begingroup$ Brilliant example!! Very useful for me. Thanks !!! $\endgroup$
    – KratosMath
    Commented Jul 31, 2018 at 14:59
  • $\begingroup$ @MsenRezaee You’re welcome! $\endgroup$
    – Taiki
    Commented Jul 31, 2018 at 16:44
17
$\begingroup$
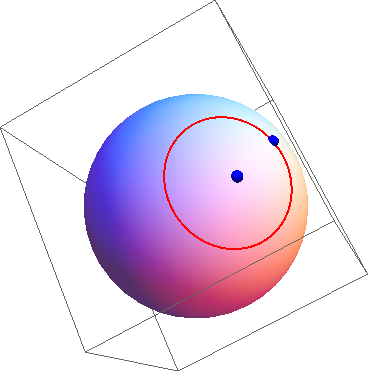
center = Normalize@{1, 2, 3};
point = Normalize@{0, 2, 1};

with minimum of algebra:

Show[
 ParametricPlot3D[
    Evaluate[ N[center + RotationMatrix[t, center].(point - center)]], 
    {t, 0, 2 Pi}],
 Graphics3D[{Sphere[], Blue, Sphere[{center, point}, .05]}]
 , PlotRange -> 1.1
 ]

enter image description here

$\endgroup$
1
  • 1
    $\begingroup$ I'm encouraging future readers to keeps scrolling down. Nice answers are awaiting attention :) $\endgroup$
    – Kuba
    Commented Apr 27, 2015 at 11:38
10
$\begingroup$

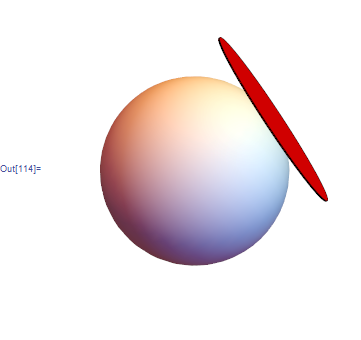
circle is 2D and sphere is 3D. Hence you are missing one dimension to make them both show together. i.e. you need orientation for the circle.

This should get you started. You can approximate a circle with Cylinder of very small length.

Graphics3D[{
  {Red, Cylinder[{{1, 0, 0}, {1.01, 0, 0}}, 1]},
  Sphere[{0, 0, 0}, 1]
  }, Boxed -> False]

Mathematica graphics

$\endgroup$
2
  • 2
    $\begingroup$ even do: EdgeForm[Red], FaceForm[Transparent] ..to actually have just a circle. $\endgroup$
    – george2079
    Commented Apr 13, 2015 at 15:57
  • $\begingroup$ Yes, this is very clever. I was thinking of somehow modifying a Cone[.] instead, but this is way better. $\endgroup$
    – Matsmath
    Commented Sep 16, 2018 at 16:00
5
$\begingroup$

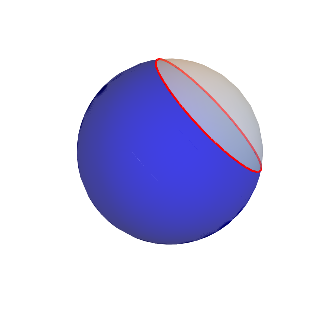
You can also plot two partial spheres and highlight where they meet

 smallSphere = ParametricPlot3D[
   {Cos[θ] Sin[ϕ], Cos[θ] Cos[ϕ], Sin[θ]},
   {θ, -π, π}, {ϕ, -π/2, π/2},
   Mesh -> None,
   PlotStyle -> {LightBlue, Opacity[0.4]},
   BoundaryStyle -> Directive[Thick, Red],
   RegionFunction -> (#2 > .6 &)
   ];
 bigSphere = ParametricPlot3D[
   {Cos[θ] Sin[ϕ], Cos[θ] Cos[ϕ], Sin[θ]},
   {θ, -π, π}, {ϕ, -π/2, π/2},
   Mesh -> None,
   PlotStyle -> {Blue, Opacity[0.5]},
   RegionFunction -> (#2 < .6 &)
   ];
Show[bigSphere, smallSphere, PlotRange -> All, Axes -> None, Boxed -> False]

enter image description here

$\endgroup$
5
$\begingroup$
draw[sphere : {sC_, sR_}, circle: {ctr_, pt_}] := 
 ParametricPlot3D[sR {Cos[u] Sin[v],Sin[u] Sin[v],Cos[v]}+sC, {u,0,2 Pi}, {v,0,2 Pi}, 
  MeshFunctions -> (Norm[{##}[[1;;3]]-ctr] - Norm[ctr-pt] &), Mesh -> {{0}}]

SeedRandom[42];
sCenter = {1, 1, 1}; sRadius = 1;
cs = Map[Plus[Normalize[#], sCenter] &, RandomReal[{-1, 1} sRadius, {10, 2, 3}], {2}]
draw[{sCenter, sRadius}, #] & /@ cs // Show

enter image description here

Also

f[r_, u_, v_]= CoordinateTransformData["Spherical"->"Cartesian","Mapping",{r, u, v}]; 

draw1[sphere : {sphC_, sphR_}, ctr_, pt_] := 
 ParametricPlot3D[f[sphR, u, v] + sphC, {u, 0, 2 Pi}, {v, 0, 2 Pi}, 
  MeshFunctions -> Function[{x, y, z, u, v}, Norm[{x, y, z} - ctr] - Norm[ctr- pt]], 
  Mesh -> {{0}}]

draw1[{{1, 1, 1}, 1}, {1, 1, 2}, {1, 0, 1}]
$\endgroup$
4
$\begingroup$

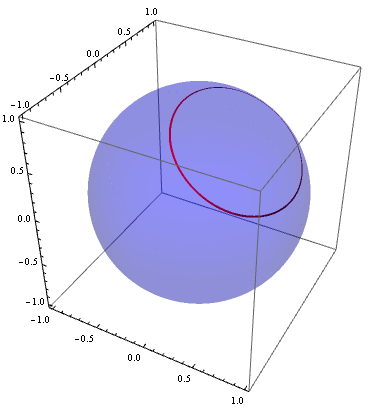
You can also use Exclusions with ParametricPlot3D:

ParametricPlot3D[{Cos[u] Sin[v], Cos[u] Cos[v], Sin[u]}, {u, -π, π}, {v, -π/2, π/2}, 
 Mesh -> None, PlotStyle -> Opacity[.25, Blue], PlotPoints -> 80, MaxRecursion -> 4,
 Exclusions -> {Cos[u] Cos[v] == .7}, 
 ExclusionsStyle -> ({Directive[Opacity[1], Thick, Red]})]

enter image description here

$\endgroup$
3
$\begingroup$

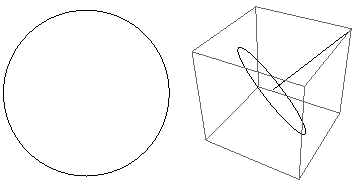
I've found this useful on a number of occasions: use a BezierCurve, which can be a 3D object, to approximate a circle.

 bezierarc[xc_, a_, b_ , r_: 1, n_: {0, 0, 1}] := 
   (* Bezier approximation to an arc *)
   (*Excellent approximation for included angle b-a < Pi/2 *)
   (* "pretty good" approximation for b-a< Pi *)
   Module[{rstar, del, p, c, d},
   c = (a + b)/2;
   d = (a - b)/2;
   rstar = (8 - ( Cos@a + Cos@b )/Cos@c )/6;
   del = (13 Sin@d - 8  Sin[d/2] Sqrt[14 + 2 Cos@d ])/9;
   p = r {
     {Cos[a], Sin[a]} ,
     rstar {Cos[c], Sin[c]} -   del {-Sin[c], Cos[c]} ,
     rstar  {Cos[c], Sin[c]} +   del  {-Sin[c], Cos[c]} ,
     {Cos[b], Sin[b]}};
   If[Length[xc] == 3 , 
      p = RotationMatrix[{ {0, 0, 1}, n}]. Append[#, 0] & /@ p];
   BezierCurve[xc + # & /@ p]]
 beziercircle[xc_, r_: 1, n_: {0, 0, 1}] := 
    bezierarc[xc, Sequence @@ # , r, n ] & /@  (Pi /2 Partition[Range[0, 4], 2, 1])

This is designed to work in 2- or 3-d:

 GraphicsRow[{Graphics@beziercircle[{0, 0}, 1] ,
    Graphics3D@{beziercircle[{0, 0, 0}, 1, {1, 1, 1}], 
           Line[{{0, 0, 0}, {1, 1, 1}}] }}]

enter image description here

for the example at hand,

   center = Normalize@{1, 2, 3};
   point = Normalize@{0, 2, 1};

of course the true circle center is not actually on the sphere so we need to do a bit of math:

 cc = center First@
     Select[ f /. 
           Solve[ (f center  - point ).(f center) == 0 , f ] , # > 0 & ]
 Graphics3D[{ Sphere[] , Thick, Red, 
      beziercircle[cc, Norm[point - cc], center] , Blue, 
          Sphere[#, .05] & /@ {center, point}}]

enter image description here

$\endgroup$
1
  • $\begingroup$ It's not clear how the beginning and the end are defined. Could you give an example: two points on unit sphere {\theta_1,\phi_1} and {\theta_2,\phi_2} - what should be used in the last entry (in the basic example it's {0, 180 Degree}). $\endgroup$ Commented Jun 15, 2022 at 21:27

Not the answer you're looking for? Browse other questions tagged or ask your own question.