15
$\begingroup$

I am new to Mathematica, and I am trying to create a 3D hexagonal mesh on a 3D surface. It is very similar to what was done in this post Create a torus with a hexagonal mesh for 3D-printing, but now instead of a torus I want a hexagonal mesh applied to the following:

p1 = Plot3D[(3*E^(-(x^2))) + 0.05, {x, -4, 4}, {y, 0, 2}, 
   PlotRange -> {-1, 4}, RegionFunction -> Function[{x, z}, x < 0], 
   Boxed -> False, Axes -> False, BoundaryStyle -> Yellow, 
   PlotStyle -> RGBColor[1, 1, 0]];

p2 = Plot3D[4.05*E^(-(0.5*x^2)) - 1, {x, -4, 4}, {y, 0, 2}, 
   RegionFunction -> Function[{x, z}, x > 0], BoundaryStyle -> Yellow,
    PlotStyle -> RGBColor[1, 1, 0]];

p3 = Plot3D[E^(-(5*(x + 0.6)^2)), {x, -4, 4}, {y, 0, 2}, 
   RegionFunction -> Function[{x, z}, x < -0.4], Mesh -> None, 
   Boxed -> False, BoundaryStyle -> Blue, 
   PlotStyle -> RGBColor[0, 0, 1]];

p4 = Plot3D[0.5*E^(-(12.5*(x + 0.6)^2)) + 0.5, {x, -4, 4}, {y, 0, 2}, 
   RegionFunction -> Function[{x, z}, -0.4 < x < 0], Mesh -> None, 
   BoundaryStyle -> Blue, PlotStyle -> RGBColor[0, 0, 1]];

p5 = Plot3D[0.5*E^(-(12.5*(x - 0.6)^2)) + 0.5, {x, -4, 4}, {y, 0, 2}, 
   RegionFunction -> Function[{x, z}, 0 <= x < 0.6], Mesh -> None, 
   BoundaryStyle -> Blue, PlotStyle -> RGBColor[0, 0, 1]];

p6 = Plot3D[2*E^(-(2*(x - 0.6)^2)) - 1, {x, -4, 4}, {y, 0, 2}, 
   RegionFunction -> Function[{x, z}, x > 0.6], Mesh -> None, 
   BoundaryStyle -> Blue, PlotStyle -> RGBColor[0, 0, 1]];

Show[p1, p2, p3, p4, p5, p6]
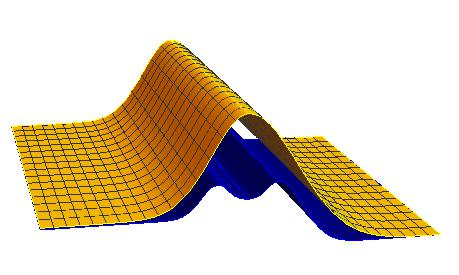
The yellow surface should be made of 3d hexagons

The yellow surface should be made of 3d hexagons. The colors doesn't matter too much. I have tried very hard to do this task, but I am not even close. I will be very greatfull if someone can help!

$\endgroup$
0

1 Answer 1

19
$\begingroup$

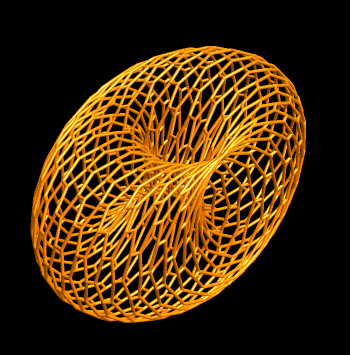
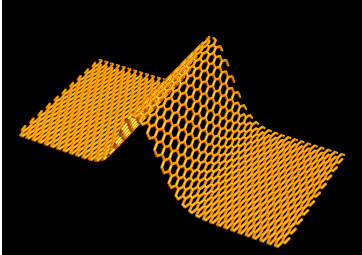
Update: With the function top defined in the original post you can replicate all the cool things you see in rm-rf's answer in the linked Q/A. For example, with a slight modification of gr1, i.e.,

Graphics3D[hexTile[20, 20] /.
   Polygon[l_] :> {Directive[Orange, Opacity[0.8], Specularity[White, 30]], 
     Polygon[l], Polygon[{Pi/5, 0} + {-1, 1} # & /@ l]} /. 
  Polygon[l_List] :> Tube[top @@@ l],
 Boxed -> False, Axes -> False, PlotRange -> All, 
 Lighting -> "Neutral", Background -> Black]

we get

enter image description here

In fact, you can use @rm-rf's hexTile with any function that can be used as the first argument of ParametricPlot3D. For example, using

foo = {Cos[#], Sin[#] + Cos[#2], Sin[#2]} &;

instead of top:

Graphics3D[hexTile[20, 20] /.
  Polygon[l_List] :> {Directive[Orange, Opacity[0.8], 
     Specularity[White, 30]], Tube[foo @@@ l]},
 Boxed -> False, Axes -> False, PlotRange -> All, 
 Lighting -> "Neutral", Background -> Black]

we get

enter image description here

Original post:

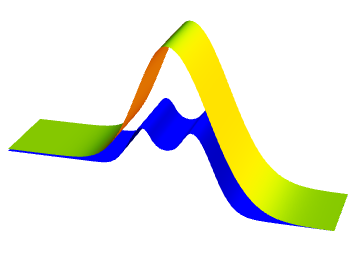
First, combining the six pieces using two piecewise functions you can use a single Plot3D:

pw1 = Piecewise[{{{3*E^(-(#^2)) + 0.05}, # <= 0},
     {{4.05*E^(-(0.5*#^2)) - 1}, # > 0}}] &;
pw2 = Piecewise[{{E^(-(5*(# + 0.6)^2)), # < -0.4},
     {0.5*E^(-(12.5*(# + 0.6)^2)) + 0.5, -0.4 <= # < 0},
     {0.5*E^(-(12.5*(# - 0.6)^2)) + 0.5, 0 <= # < 0.6},
     {2*E^(-(2*(# - 0.6)^2)) - 1, 0.6 <= #}}] &;

Plot3D[{pw1[x], pw2[x]}, {x, -4, 4}, {y, 0, 2},
 PlotRange -> All, Boxed -> False, Axes -> False, 
 BoxRatios -> Automatic, PlotStyle -> {Yellow, Blue}, PlotPoints -> 80,
 Mesh -> None, Exclusions -> None, BoundaryStyle -> None]

enter image description here

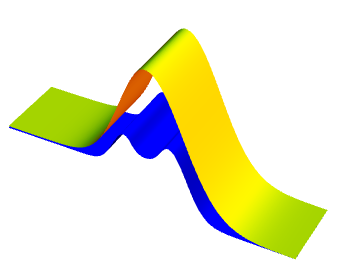
Alternatively, you can use a single ParametricPlot3D with the following piecewise functions:

top = Piecewise[{{{#, #2, 3*E^(-(#^2)) + 0.05}, # <= 0},
     {{#, #2, 4.05*E^(-(0.5*#^2)) - 1}, # > 0}}] &;
bottom = Piecewise[{{{#, #2, E^(-(5*(# + 0.6)^2))}, # < -0.4},
     {{#, #2, 0.5*E^(-(12.5*(# + 0.6)^2)) + 0.5}, -0.4 <= # < 0},
     {{#, #2, 0.5*E^(-(12.5*(# - 0.6)^2)) + 0.5}, 0 <= # < 0.6},
     {{#, #2, 2*E^(-(2*(# - 0.6)^2)) - 1}, 0.6 <= #}}] &;

ParametricPlot3D[{top[x, y], bottom[x, y]}, {x, -4, 4}, {y, 0, 2},
 PlotRange -> All, Boxed -> False, BoxRatios -> Automatic, Axes -> False,
 PlotStyle -> {Yellow, Blue}, PlotPoints -> 80, Mesh -> None, Exclusions -> None]

enter image description here

You can use the functions top and bottom in combination with @rm-rf's hexTile function from the linked Q/A

hexTile[n_, m_] := With[{hex = Polygon[Table[{Cos[2 Pi k/6] + #, Sin[2 Pi k/6] + #2},
  {k, 6}]] &},
        Table[hex[3 i + 3 ((-1)^j + 1)/4, Sqrt[3]/2 j], {i, n}, {j, m}] /. 
            {x_?NumericQ, y_?NumericQ} :> 2 π {x/(3 m), 2 y/(n Sqrt[3])}]

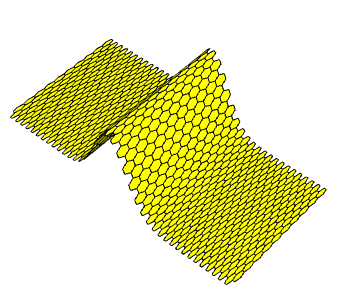
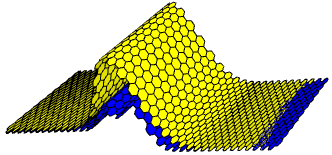
gr1 = Graphics3D[hexTile[20, 20] /.
    Polygon[l_] :> {Yellow, Polygon[l], Polygon[{Pi/5, 0} + {-1, 1} # & /@ l]} /. 
   Polygon[l_List] :> Polygon[top @@@ l],
  Boxed -> False, Axes -> False, PlotRange -> All, Lighting -> "Neutral"]

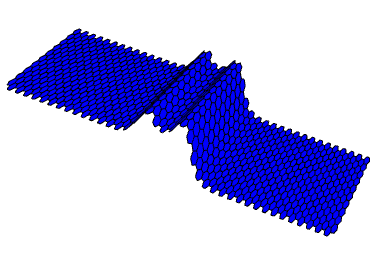
enter image description here

gr2 = Graphics3D[hexTile[20, 20] /.
    Polygon[l_] :> {Blue, Polygon[l], Polygon[{Pi/5, 0} + {-1, 1} # & /@ l]} /. 
   Polygon[l_List] :> Polygon[bottom @@@ l],
  Boxed -> False, Axes -> False, PlotRange -> All, Lighting -> "Neutral"]

enter image description here

Show[gr1, gr2]

enter image description here

Note: You need to play with the pair of numbers {Pi/5,0} to control gaps and/overlaps between piecewise components.

$\endgroup$
2
  • $\begingroup$ Thank you very much! Exactly what I needed! $\endgroup$
    – Hans
    Commented Mar 15, 2015 at 16:05
  • $\begingroup$ @Hans, my pleasure.Thank you for the accept. And welcome to mma.se. $\endgroup$
    – kglr
    Commented Mar 15, 2015 at 16:13

Your Answer

By clicking “Post Your Answer”, you agree to our terms of service and acknowledge you have read our privacy policy.

Not the answer you're looking for? Browse other questions tagged or ask your own question.