2
$\begingroup$

In Mathematica help it's written that:

ListDensityPlot[array] -> generates a smooth density plot from an array of values.

There is also an example:

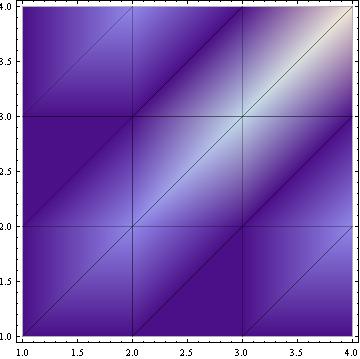
 ListDensityPlot[{{1, 1, 1, 1}, {1, 2, 1, 2}, {1, 1, 3, 1}, {1, 2, 1, 4}}, Mesh -> All]

enter image description here

I understand when the input is in the form of $ \{ x, y, f(x,y)\}$, what this function does. But, I really cannot understand what this function does when it has an array as an input.

$\endgroup$
2
  • $\begingroup$ What does the forth element mean in the example above? I think for density plot we mush have two value for coordinate and one value for the intensity or density in that coordinate. But in the example above I cannot find such a pattern. $\endgroup$
    – MOON
    Commented May 9, 2014 at 15:54
  • 1
    $\begingroup$ please note the preamble in the documentation for the example: "Use an array of values to define heights for a density". See also ReliefPlot and see the effect of arrays of various sizes eg 7x 5 or whatever you like. Look through all the examples. $\endgroup$
    – ubpdqn
    Commented May 9, 2014 at 16:36

1 Answer 1

9
$\begingroup$

The answer about the pattern you are missing:

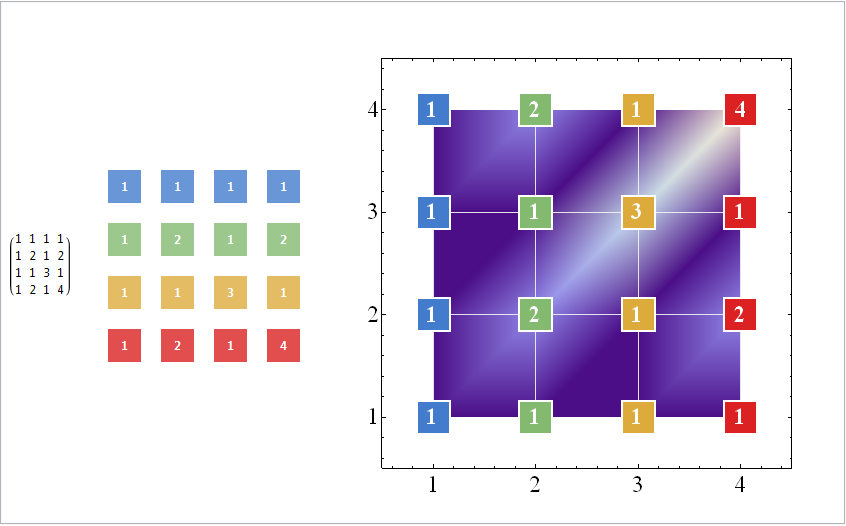
each value in an array is the value that generates color for Integer coordinates like (1,1) between those an interpolation is done by ListDensityPlot.

Matrices world:

  • First index refers to rows
  • First row is the top one

Graphics world

  • First coordinate refers to "columns"
  • First "row" refers to the bottom one.

enter image description here

Panel@Grid[{
   {MatrixForm@array,
    Grid[MapIndexed[
      Framed[#, 
        Background -> 
         Directive[[email protected], Blend["Rainbow", #2[[1]]/4]], 
        ImageSize -> 35 {1, 1}, Alignment -> Center, 
        BaseStyle -> {Bold, White}] &, array, {2}], 
     Spacings -> 1.5 {1, 1}]
    ,
    ListDensityPlot[array,
     BaseStyle -> 24, Mesh -> Full, MeshStyle -> White, 
     PlotRangePadding -> .5,
     Epilog -> {MapIndexed[
        Inset[Framed[#, 
           Background -> 
            Directive[Opacity[4/#], Blend["Rainbow", #2[[1]]/4]], 
           ImageSize -> 35 {1, 1}, Alignment -> Center, 
           BaseStyle -> {Bold, White}], #2] &, array, {2}]},
     ImageSize -> 500, ImagePadding -> 45]
    
    }}, Alignment -> Center, Spacings -> 3]
$\endgroup$
2
  • 2
    $\begingroup$ @Kuba. Thank you for your elegant and beautiful answer. $\endgroup$
    – MOON
    Commented May 9, 2014 at 17:52
  • $\begingroup$ @yashar I'm glad I could help :) Good luck. $\endgroup$
    – Kuba
    Commented May 9, 2014 at 18:23

Your Answer

By clicking “Post Your Answer”, you agree to our terms of service and acknowledge you have read our privacy policy.

Not the answer you're looking for? Browse other questions tagged or ask your own question.