2
$\begingroup$

I generate a periodic discrete data representing a time dependent function and I want to apply a discrete Fourier transform to this data using just one period of it.

I think something is wrong with my Fourier transform code:

a = 0.05; L = 15; T = 20 \[Pi]; hdc = 2.1;
sol = NDSolve[{a*D[u[t, x], t] == D[u[t, x], x, x] - Sin[u[t, x]], 
u[0, x] == 0, Derivative[0, 1][u][t, 0] == Tanh[t/0.01]*hdc, 
Derivative[0, 1][u][t, L] == 0}, u, {t, 0, T}, {x, 0, L}, 
MaxStepSize -> 0.005, MaxSteps -> 10^6];
q := NIntegrate[( 
Evaluate[First[Derivative[1, 0][u][tp, x] /. sol]])^2, {x, 0, L},
Method -> "LocalAdaptive", MinRecursion -> 50, 
MaxRecursion -> 100];
data = Parallelize[Table[q, {tp, 25.8, T, 0.5}]];
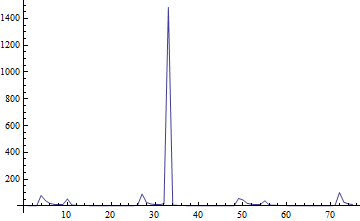
ListLinePlot[data, PlotRange -> All]
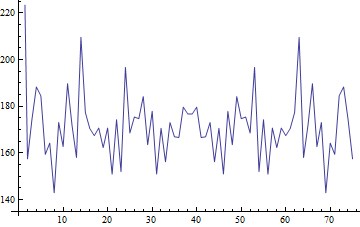
ListLinePlot[Abs[Fourier[data]]]
enter image description here enter image description here

$\endgroup$
5
  • 1
    $\begingroup$ On a core-i7 extreme it does not take much time to evaluate around 124 sec using LaunchKernels[10]. But its very memory hungry even with 64GB RAM I went more than 80% few times during the computation. But now I can offer the onlooker those plots ... $\endgroup$ Commented Sep 12, 2012 at 13:23
  • $\begingroup$ Guys,I do get the same result on my machine,but I think this Fourier analysis doesn't make sense,at least my supervisor says so.he says I have to tell the program that my function is periodic,so that the Fourier transform of it should go to zero for t infinity. $\endgroup$ Commented Sep 12, 2012 at 13:53
  • $\begingroup$ @AhmadSheikhzada Editting your code by involving MemoryConstrained may help lots of people who would like to run your code! :P $\endgroup$
    – dearN
    Commented Oct 14, 2012 at 23:08
  • $\begingroup$ @AhmadSheikhzada I am curious about the computational resources that are available to you. Could you please expand on that? Thanks! $\endgroup$
    – dearN
    Commented Oct 15, 2012 at 18:03
  • $\begingroup$ @AhmadSheikhzada Did you consider plotting your DFT data using MatrixPlot. It makes it look neater. Here's my question as an example. Noted that I also used a Hard threshold value to obtain these plots. $\endgroup$
    – dearN
    Commented Oct 15, 2012 at 20:23

1 Answer 1

6
$\begingroup$

Assuming your calculated data are correct, the first ListLinePlot shows what is an approximate delta-function, that is, a single isolated spike. The Fourier transform of a delta-function produces a flat spectrum, that is, a constant at all frequencies. Your second ListLinePlot of Abs[Fourier[data]] looks like a constant, plus or minus some noise. Thus, it looks fine to me...

Also note that the discrete Fourier transform assumes and induces periodicity of the input data, so you need not "tell the program that [your] function is periodic".

$\endgroup$

Your Answer

By clicking “Post Your Answer”, you agree to our terms of service and acknowledge you have read our privacy policy.

Not the answer you're looking for? Browse other questions tagged or ask your own question.