2
$\begingroup$

I have several lists of experimental data f[x] with different intervals Δx including some noise.

listAll = {
   list1 = Table[{x, Exp[1/x + 1] + RandomReal[]}, {x, 0.1, 3, 0.02}],
   list2 = Table[{x, Exp[1/x - 1] + RandomReal[]}, {x, 0.1, 3, 0.03}]
   };

I'd now like to create a function that calculated the average of the values in the lists and their standard deviation. This is how far I got:

interpol[data_] := Interpolation /@ data
average[data_, res_] := Table[
   {x, 
    Mean[Table[interpol[data][[y]][x], {y, Length@data}]],
    StandardDeviation[Table[interpol[data][[y]][x], {y, Length@data}]]},
   {x, Max[data[[;; , 1, 1]]], Min[data[[;; , -1, 1]]], res}];

which looks plotted this:

ListPlot[{list1, list2, average[listAll, 0.02][[;; , {1, 2}]]}]
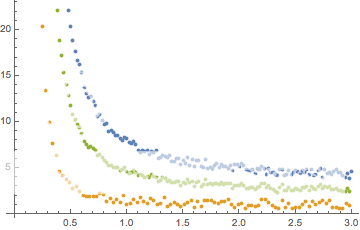
plot

I have two questions.

  • Is a way to use # & to access my list data instead of using the nested Table?
  • Is it possible to use BSplineFunction instead of Interpolation to reduce the influence of the noise?
$\endgroup$
0

3 Answers 3

6
$\begingroup$

Filtering first:

filetredLists = Transpose /@ ({#1, WienerFilter[#2, 6, .1]} & @@@ Transpose /@ listAll);
ip = Interpolation /@ filetredLists;
average[x_] := Mean@Through[ip[x]]; 
Plot[average[x], {x, .2, 3}, Epilog -> Point /@ listAll, PlotRange -> {Automatic, {0, 40}}]

Mathematica graphics

$\endgroup$
1
  • $\begingroup$ This is very nice! Thank you! Through is exactly the function I needed and filtering the data before is a great idea. I'll take a look into the different filter option to know what I'm doing. $\endgroup$
    – Jason
    Feb 27, 2015 at 16:54
3
$\begingroup$

Another approach is to interpolate the full sets of points, and then average the interpolating functions.

intL1 = Interpolation[list1, InterpolationOrder -> 1];
intL2 = Interpolation[list2, InterpolationOrder -> 1];
Plot[{intL1[x], intL2[x], (intL1[x] + intL2[x])/2}, {x, 0.1, 3}]

enter image description here

It is also possible to smooth the average. A linear smoothing filter is a convolution of the data function with a kernel -- below I chose a Gaussian kernel. (I snitched the NConvolve function from Andrew Moylan.)

NConvolve[f_, g_, x_, y_?NumericQ] := NIntegrate[f (g /. x -> y - x), {x, -Infinity, Infinity}];
g[y_] = PDF[NormalDistribution[0, 0.1], y];
smooth[x_] = NConvolve[(intL1[y] + intL2[y])/2, g[y], y, x];
Plot[{intL1[x], intL2[x], smooth[x]}, {x, 0.5, 3}]

enter image description here

$\endgroup$
1
$\begingroup$

Yet another approach -- use TemporalData:

td = TemporalData[{list1, list2}];
{min, max} = {Max@Min@#, Min@Max@#2} & @@ td["Times"];
r1 = Range[min, max, .02];
tdm = TemporalData[Mean[td@r1], {r1}];
ListPlot[Join[td["Paths"], tdm["Paths"]], Joined -> {False, False, True}]

enter image description here

ListPlot[Join[td["Paths"], tdm["Path", All, {min, max, (max - min)/20}]], 
         Joined -> {False, False, True}]

enter image description here

$\endgroup$

Your Answer

By clicking “Post Your Answer”, you agree to our terms of service and acknowledge you have read our privacy policy.

Not the answer you're looking for? Browse other questions tagged or ask your own question.