As per comments above, barChartDigitizer can be extended to {x,y} scatter plots.
scatterPlotDigitizer[g_Image] :=
 DynamicModule[{ymin, yminValue = 0., ymax, ymaxValue = 1., xmin,
   xminValue = 0., xmax, xmaxValue = 1., pt = {0, 0}, data = {},
   img = ImageDimensions[g], output},

  Deploy@Column[{
     Row[{
       Grid[{
         {Button["Y Axis Min", ymin = pt[[2]]],
          Button["Y Axis Max", ymax = pt[[2]]]},
         {InputField[Dynamic[yminValue], Number, ImageSize -> 70],
          InputField[Dynamic[ymaxValue], Number, ImageSize -> 70]},
         {Button["X Axis Min", xmin = pt[[1]]],
          Button["X Axis Max", xmax = pt[[1]]]},
         {InputField[Dynamic[xminValue], Number, ImageSize -> 70],
          InputField[Dynamic[xmaxValue], Number, ImageSize -> 70]}
         }],
       Column[{Button["Add point", AppendTo[data, pt]],
         Button["Remove Last", data = Quiet@Check[Most@data, {}]]}],
       Column[{Button["Start Over", data = {}],
         Button["Print Output",
          output =
           Transpose[{Rescale[#, {xmin, xmax}, {xminValue,
                 xmaxValue}] & /@ data[[All, 1]],
             Rescale[#, {ymin, ymax}, {yminValue, ymaxValue}] & /@
              data[[All, 2]]}];
          Print@Column[{ListPlot[output, ImageSize -> 400,
              PlotRange -> {{xminValue, xmaxValue}, {yminValue,
                 ymaxValue}}], output}],
          Enabled -> Dynamic[data =!= {}]]}]
       }],
     Row[{
       Graphics[{Inset[
          Image[g, ImageSize -> img]], {Tooltip[Locator[Dynamic[pt]],
           Dynamic[pt]]}},
        ImageSize -> img, PlotRange -> 1,
        AspectRatio -> img[[2]]/img[[1]]]}]
     }]
  ]
The steps to using this function are:
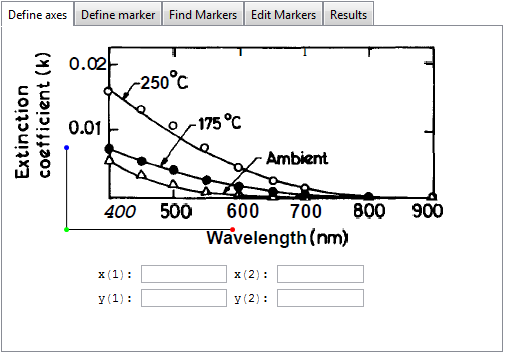
Copy the image of the plot you want to digitize and paste it as an argument to scatterPlotDigitizer.
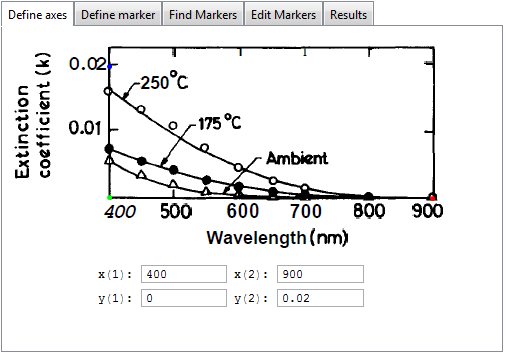
Enter the minimum and maximum y axis values in the input fields.
Enter the minimum and maximum x axis values in the input fields.
Place the locator on the y minimum and click "Y Axis Min."
Place the locator on the y maximum and click "Y Axis Max."
Place the locator on the x minimum and click "X Axis Min."
Place the locator on the x maximum and click "X Axis Max."
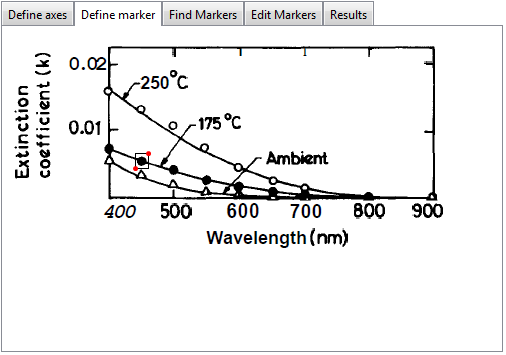
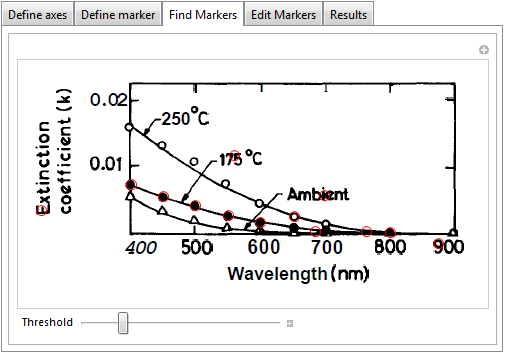
Then place the locator over a point and click "Add point."
When you're done click "Print Output."
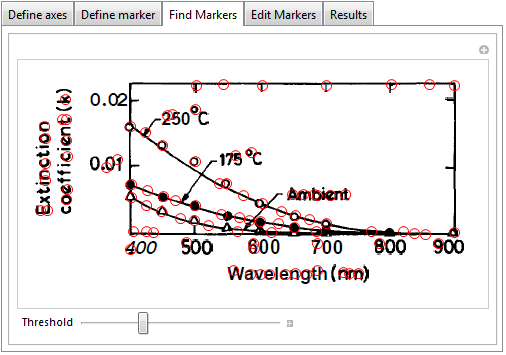
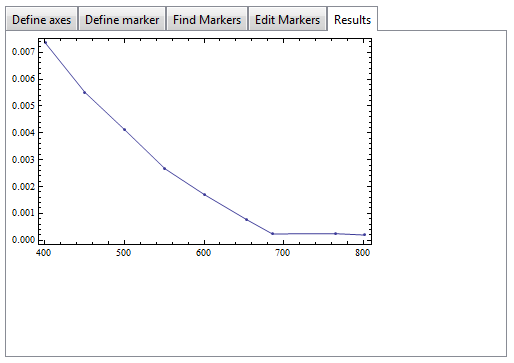
when applied to your plot you get:
data4 = {{401.5337423312884`,
    0.0159090909090909`}, {450.6134969325154`,
    0.013181818181818173`}, {501.2269938650307`,
    0.010757575757575744`}, {548.7730061349694`,
    0.007272727272727254`}, {600.920245398773`,
    0.00439393939393937`}, {654.601226993865`,
    0.0024242424242423948`}, {702.1472392638036`,
    0.0012121212121211783`}, {800.3067484662575`, \
-0.0003030303030303362`}};

data5 = {{403.0674846625767`,
    0.007272727272727247`}, {452.14723926380367`,
    0.005454545454545431`}, {502.760736196319`,
    0.003939393939393916`}, {551.840490797546`,
    0.002575757575757554`}, {600.920245398773`,
    0.0015151515151514937`}, {654.601226993865`,
    0.0007575757575757416`}, {703.680981595092`,
    0.00030303030303028763`}};

data6 = {{401.5337423312884`,
    0.005303030303030292`}, {452.14723926380367`,
    0.003181818181818171`}, {499.69325153374234`,
    0.001818181818181809`}, {550.3067484662577`,
    0.0007575757575757486`}, {602.4539877300613`,
    0.0001515151515151386`}};

p2 = ListLinePlot[{data5, data4, data6},
  Frame -> True,
  FrameLabel -> {{"Extinction\ncoefficient (k)",
     None}, {"Wavelength (nm)", None}},
  FrameTicks -> {{{0.01, 0.02},
     None}, {{400, 500, 600, 700, 800, 900}, None}},
  FrameTicksStyle ->
   Directive[FontFamily -> "Helevetica", 16, Black, Bold],
  ImageSize -> 400,
  ImagePadding -> {{90, 20}, {50, 1}},
  LabelStyle -> Directive[FontFamily -> "Helevetica", 16, Black, Bold],
  PlotRange -> {{xminValue, xmaxValue}, {0, 0.0225}},
  PlotMarkers -> {
    {Graphics[{EdgeForm[Directive[Thick, Thick]], Black,
       Disk[{0, 0}, 1]}],
     0.05}, {Graphics[{EdgeForm[Directive[Thick, Thick]], White,
       Disk[{0, 0}, 1]}],
     0.05}, {Graphics[{EdgeForm[Directive[Thick, Thick]], White,
       Polygon[{{0, 0}, {0.5, 0.707}, {1, 0}}]}], 0.05}
    },
  PlotStyle -> Black]
and
data1 = {{401.5337423312883`,
    2.4784615384615387`}, {449.07975460122697`,
    2.3984615384615386`}, {499.6932515337423`,
    2.3400000000000003`}, {550.3067484662575`,
    2.293846153846154`}, {599.3865030674846`,
    2.263076923076923`}, {651.5337423312883`,
    2.241538461538462`}, {700.6134969325153`,
    2.2292307692307696`}, {751.2269938650306`,
    2.216923076923077`}, {800.3067484662577`,
    2.210769230769231`}, {900.`, 2.201538461538462`}};

data2 = {{401.5337423312884`,
    2.5237113402061855`}, {449.079754601227`,
    2.4556701030927837`}, {501.2269938650307`,
    2.4`}, {548.7730061349694`,
    2.3597938144329897`}, {599.3865030674847`,
    2.3288659793814435`}, {651.5337423312883`,
    2.304123711340206`}, {700.6134969325153`,
    2.288659793814433`}, {749.6932515337423`,
    2.2731958762886597`}, {798.7730061349694`,
    2.260824742268041`}, {900.`, 2.245360824742268`}};

data3 = {{400.`, 2.4494845360824744`}, {449.0797546012271`,
    2.369072164948454`}, {498.1595092024541`,
    2.316494845360825`}, {548.7730061349694`,
    2.276288659793815`}, {599.3865030674847`,
    2.239175257731959`}, {651.5337423312884`,
    2.2144329896907218`}, {699.079754601227`,
    2.205154639175258`}, {749.6932515337423`,
    2.1958762886597936`}, {800.3067484662577`,
    2.1896907216494843`}, {898.4662576687116`, 2.183505154639175`}};

p1 = ListLinePlot[{data1, data2, data3},
  Epilog -> {Inset[
     Style["Starting material TiO:\nIonised oxygen",
      FontFamily -> "Helevetica", 14, Black, Bold],
     ImageScaled[{0.55, .82}], {Left, Top}]},
  Frame -> True,
  FrameLabel -> {{"Refractive\nIndex (n)", None}, {None, None}},
  FrameTicks -> {{{2.1, 2.3, 2.5, 2.7}, None}, {None, None}},
  FrameTicksStyle ->
   Directive[FontFamily -> "Helevetica", 16, Black, Bold],
  ImageSize -> 400,
  ImagePadding -> {{90, 20}, {7, 10}},
  LabelStyle -> Directive[FontFamily -> "Helevetica", 16, Black, Bold],
  PlotRange -> {{xminValue, xmaxValue}, {yminValue, ymaxValue}},
  PlotMarkers -> {
    {Graphics[{EdgeForm[Directive[Thick, Thick]], Black,
       Disk[{0, 0}, 1]}],
     0.05}, {Graphics[{EdgeForm[Directive[Thick, Thick]], White,
       Disk[{0, 0}, 1]}],
     0.05}, {Graphics[{EdgeForm[Directive[Thick, Thick]], White,
       Polygon[{{0, 0}, {0.5, 0.707}, {1, 0}}]}], 0.05}
    },
  PlotStyle -> Black]
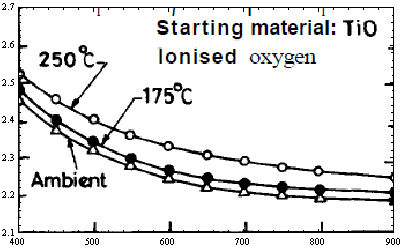
which can be combined to give:
Grid[{{p1}, {p2}}, Spacings -> 0]
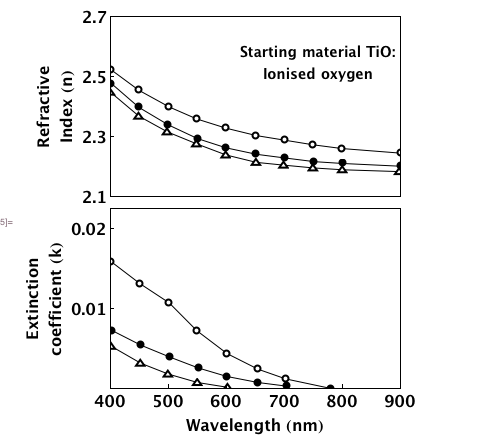
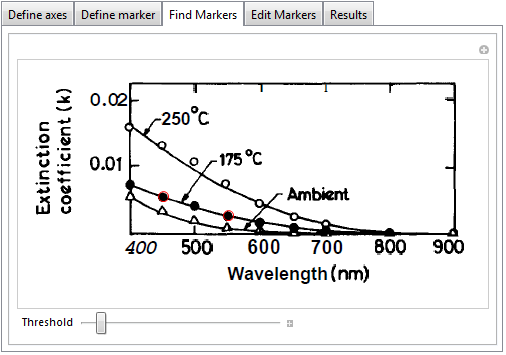
I have used ListLinePlot to join the dots simply to show this working but your chart appears to have fitted lines (most notable in the bottom chart) ...which you could add. I haven't bothered to change the tick lengths or adding the arrows, aspect ratio etc.
This is of course is a time consuming way of extracting points but it works. Also if the image is distorted you can probably fix this using some of the corrective measures described by others in the Q&A that you linked to.
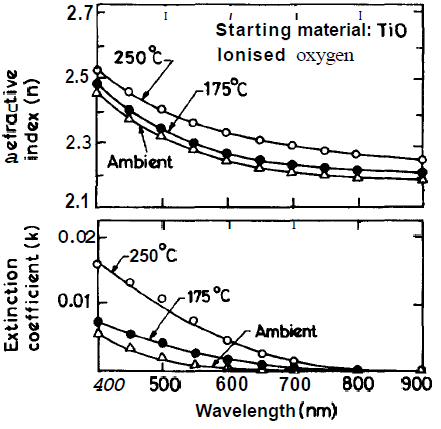

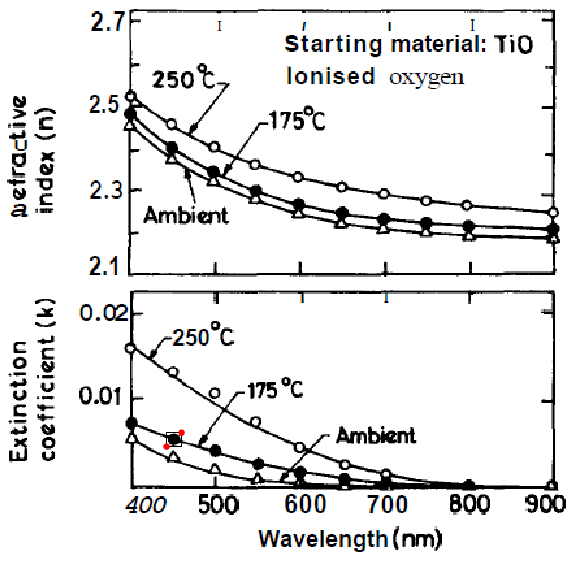
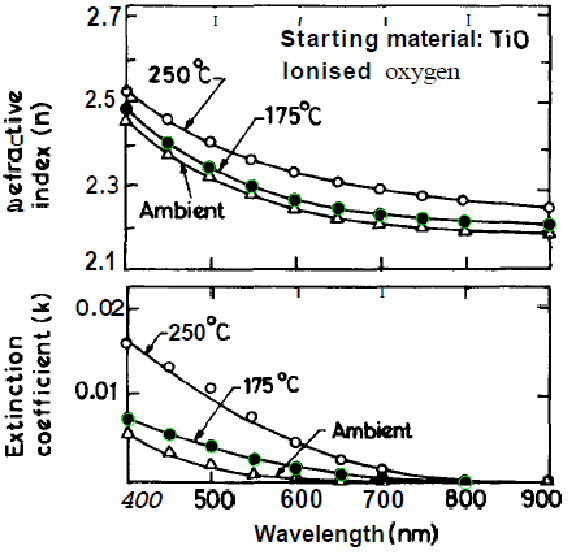

 .
.

barChartDigitizerfailed? $\endgroup$